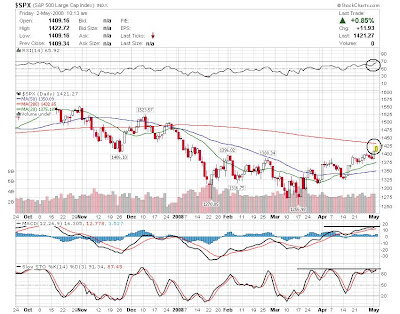
I DON'T BUY IT FOR A SECOND!!
Dow jones chart

S&P

WE ARE NEARING A TOP. I DON'T BUY THESE RALLIES AT ALL. I strongly feel any new money being put long at this point is suckers money. I am growing more and more bearish everyday.
I predict within the next 3-4 sessions we are going to get some piece of news that'll send us lower. Indices have hit the 200DMA. But the first test into a moving average resistance will almost certainly fail. And that is when we are going to have that selloff back down (at least 50% retracement of gains I believe)
7 comments:
Dear xman,
I was reading the lines and wonder how do you gauge the 50% retracement of gains, would you mind to plot that out please when you are free? (is it going to be based on 6-months chart, 1-year or shorter term)
Best Regards
Joul
Money cyclying back into commodities/energy today. Fed firing up the printing presses. Very strange market.
X, you read my mind, I was about to ask you where you thought the indexes are going. Anybody could see that they were overbought.
I was wondering if you had any ideas of a good buy that costs between $3x and $5x per share? As the dollar gains I don't like STLD as much as I used to I think its a good weak dollar play.
Hey xman,
Your blog is the most interesting I'm reading right now, I've just started investing some money and so far it has worked pretty well. Then again, I've played it safe, some trades that even I could see coming.
Yahoo trade for today isn't really rocket science...Some people bought at the lowest (opening market) and sold a few hours later, free money you say ?
I've been following MoneyGram (NYSE:MGI) but kinda lost it and today boom +16% well...What does your analysis tell you about this, and even better where can I learn to read charts ?
Thanks your blog is a gem.
M.
M.
The best resource to learning how to read charts is going to www.investopedia.com first to know the terminologies and each technical's function.
Then I would say go to www.stockcharts.com they provide very good charts for free.
Email me if you have more questions
joul ooi,
50% retracements are using Fibonacci triangles :)
mr. jeanius,
What sector are you interested in? It also depends on your investment style, the stock beta tolerance level you have, etc.
Let me know your thoughts, good luck!
Post a Comment