Friday, May 30, 2008

JCREW Fire Sale = Our Opportunity

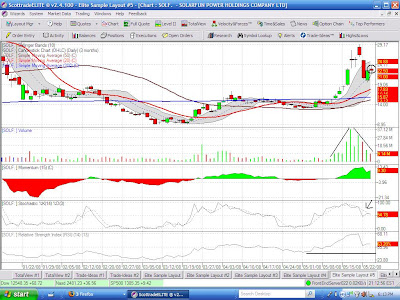
JCREW (JCG) Getting ANNIHILATED today. It hasn't seen this type of fire sale the last 12 months! Hell take that back, it hasn't seen this type of fire sale since its IPO! Look at the volume bar! That's what I call M U R D E R E D. But this is so overkilled that I believe we can buy it for a quick scalp.


- Note the double bottom that is holding since the January Lows

I am buying it for a trade right now at $37.35 going to ride the reflex bounce potentially back up to $40~

Let's see if it'll work out.

I am selling half my PWRD position @ $27. Made nearly 4 points on it. No one ever made a dime being greedy. So it's time to sell.

Markets are setting up now perfectly for the next leg down. If you are long stocks, pick your spots and stay disciplined!

- DL

Disclosure
Long GOOG, 75% V, 35% PWRD, JCG
Short USO

Thursday, May 29, 2008

Sell into this Rally

Charts show markets have retraced back up since the plunge but now right below the 50DMA. The bounce should be coming to an end soon. If you have been trading the long side, in my opinion consider to start selling.

I have not been trading too much the past few days. There are some personal matters that I have to attend to so I'm not able to trade or update the blog too much. Good luck everyone.

-DL

Wednesday, May 28, 2008

Watch the PWRD pullback

I am on the run again today so I will do my post later this afternoon. But if you have been trading PWRD with me, congrats to us we are up nicely now. Watch PWRD potentially pull back though if it doesn't clear the 50/200DMA from a 3 month perspective. However, if it does pull back, this is the point in my opinion to add position:


Watch the $25.27 "Necktie" intraday support. when two MA's converge together like that it is usually very strong and not likely to break.

Good luck today. Invest wisely and be careful out there.

-DL

Disclosure
Long GOOG, 75%V, 70% PWRD
Short USO

Tuesday, May 27, 2008

How I Daytrade

So I have a few readers interested in knowing how I daytrade SOLF and how to look for entry/exit points. It is tough to explain with text and honestly if I had a way to post videos instead it would be much easier to understand. But here it is to the best of my knowledge.

Day trading is about understanding price, pattern, time, and volume at a specific moment and then utilizing indicators to predict the potential future movement of the stock. When I day trade, I first study where the stock has been. To do this, I pull up a 3 month daily chart - That is the daily movement of the stock price for the past 3 months.


From a 3 month chart, the amount of volume in the past couple weeks is unmistakably higher. More volume = more volatility.

throughout the past week SOLF has made a gigantic move up since its breakout from the 200DMA (remember my post about that from a couple weeks back?), topped out near 29, and have sold off. It has then subsequently touched the middle bollinger line (the dotted line within the shade), and bounced. Since the price level of the stock is now currently below the upper bollinger line, I will reasonably expect the stock to once again hit resistance as it reaches there ($24.88).

The stochastics tell me the stock has a big potentially to continue down because the solid line is trapped below the dotted line.. When the solid cannot breakout from the dotted, it is a bearish indicator.


Now lets look at the 2 day 10 minute chart.


Reading a 10 minute chart is almost identical to reading wider time scale charts with a few exceptions - more emphasis needs to be placed on technical indicators as well as the price pattern that is forming. The indicator I pay attention to the most is the stochastics. During the intraday if the stochastics reaches 90-100 percentile, that is my target to put on short positions. Notice as the stochastic started coming down the stock tanked with it.

The price pattern is even more important. Notice where I boxed the bottom and top of the stock intraday. During the bottom, we see the stock touching the 50DMA and bounced. The reason I know it bounced is because of the "bottoming tail" that emerged. This means, during the 10 minutes when those bars were active, the stock got sold off to that level and when it touched the moving average buyers came in and boosted the stock price back up. When you see multiple bottoming tails (stock has to close in the top 25% tier of the candle), along with the stochastics at the 10-20 percentile, THAT IS THE SIGNAL TO COVER SHORT POSITIONS AND GO LONG.

Notice also during the very extreme of the selloff, the momentum indicator also shows a severe bias towards the red side, when that occurs, it is also the signal to cover.

The same with topping action. Notice the top box I drew in. When the stock is starting to top off, you will see the stochastics reaching 90%+, you will see the momentum indicator skewed towards the green, and the most important would be the "topping tails". Just like a bottoming tail, a topping tail occurs when the stock gets a bid at certain prices but cannot sustain. During the 10 minutes when those bars were active, the stock pushed up toward higher highs', and as they got up, sellers came in and locked profits. When there are multiple topping tails emerging (stock has to close in the bottom 25% tier of the candle), along with the stochastics at the 90-100 percentile, THAT IS THE SIGNAL TO SELL LONGS AND INITIATE SHORTS.

Understanding how the chart patterns work is already half the battle. Add all the other technical indicators into the equation allows me to predict with about 75-80% certainty of what the stock will do next. It is not an exact science though and sometimes it is very tough to gauge it during a live session. It is one thing to study the charts now "After the fact" versus trading it live. Even with all these indicators, I still mess up from time to time. Today because I didn't stay disciplined my intraday gains were wiped. But this is my method to day trade.

Finally, the Level II stream as well as the velocity meter provide great tells to the stock momentum and is vital to day trading. It gives day traders very good ideas the amount of bids being queued on the long and short side, as well as telling me the intensity of the buy and sells.

Day trading is about putting all the pieces to the puzzle together and being nimble. In addition, the amount of shares you can trade is very important as well. Because the more shares you are able to move around, the less time exposure it is required for the trade. And less time exposure = less risk. Factors such as capital gain taxes and transaction fees also needs to be considered because those are expenses that cannot be avoided. Trading 100 shares of SOLF at 30 cents gain will only equate in 30 dollars of profit. In the scheme of percentage movement, that is a sizeable gain. But 30 dollars of profit subtract on average 15 dollars in transaction fee would mean already half the profit is wiped. Then consider the 30%~ of taxes that has to be paid, it wouldn't leave too much profit left and thus not worthwhile for the effort put in. Not to mention in order for a 20 dollar stock to move 1 dollar will require massive amount of volume. And the longer a daytrade is in place, the more risk it gets exposed to.

But 1000 shares on 30 cents profit would equate to 300 dollars. 300 dollars subtract 15 dollar transaction fees = 285 dollars then deduct roughly 30% in capital gain taxes would still leave a net profit of $200. Now that is more like it. Make sure to consider whether day trading is suitable for you in terms of risk as well as the rewards. Make sure it is worth the effort!

Good luck!

New Week

Had a great weekend, I hope everyone did too. I went camping for the entire weekend so I didn't get a chance to do homework on new stocks. Have some catch up work to do.

Markets are trading flat right now after the morning's rally fizzled. I think we can reasonably expect the indices to have a day or two of pauses. Last week it went down too fast without any sort of bounces.

PWRD is a winner now once again. Congrats if you bought in on the call (or if you had a fill order @ 24 because that was exactly where it opened).

If you still have it, theres a choice to be made right now (since it is up 5%).

If you believe the markets will eventually take a hit again, and therefore pulling PWRD potentially even lower, then hey, a 5% gain in one session isn't that bad. Or, you can wait for PWRD to rebound to its 200DMA and 50DMA @ $26. Which at that point would be heavy resistance and thus result in another round of selloff.

If you believe even throughout the market turmoil PWRD will eventually retrace back to 30+, then just hold on to it. And maybe set a stop at $22.

I am going to hold on to it for now. I will see what happens when the stock hits $26. PWRD historically breaks resistance very easily. Meaning support usually isn't support, and resistance isn't so either...let's see what happens.

SOLF in my humble opinion is currently one of the best day trading stocks around. The swings are so great yet the market cap of the company is small enough that if you trade anything above 1000 shares you can actually see your buy and sells moving the stock!! It's pretty fascinating. I have been day trading SOLF for a week now and have made a killing doing so. I am going to continue to do it until the trade is broken and the volatility dies out.

Someone also asked me about what I'm going to do with my USO short. My stop loss on it is at $110. If it goes anywhere below triple digits (below 100) then I'll probably cover. I still believe that oil needs to have a very big pullback. But I've had the trade for nearly two weeks now. I feel my money could be put to better use elsewhere.

Let's see what happens later today.

-DL

Disclosure
Long GOOG, 75% V, 70% PWRD
Short USO
Actively Day Trading SOLF

Friday, May 23, 2008

No Mercy Into Memorial Day

Well I thought the markets would be more merciful and just stay flat going into Memorial day. Looks like that was wishful thinking.

As of 10AM the markets are down over 1.2%~ across the board. It seems like wall street wants to reduce exposure going into the weekend.

My PWRD position getting dumped hand over fist. Stock is down another 5%. I am adding another 20% into my position right now @ $23.70 The stock is taking a huge hit today no doubt. But note that the stock has been liquidated from its high of 33.52 all the way to now @ 23.7 = $10 dollars. It is getting toward that point where the dumping should start to ease up. And looking at the chart -


we can see it is really nearing oversold status (note what happened the last 3 times when the stock's RSI neared 30 and the massive rebound that ensued). There's also an uptrend (indicated by the line I drew) that shows it should be bottoming out soon. If you are still short the position, many congrats for making a KILLING off this baby. But I strongly suggest to consider start locking in gains. Note the diminishing sell volume along with the oversold technicals. Also note the similar sell pattern we are seeing from previous massive dumps.

It's not going to rebound overnight. But I'm going to hold on to this one for a while rather than day trading it. I think this will at least rebound back to near $30 in the days to come. Not saying it won't have volatility. But we've seen where it has gone before not so long ago. And last quarter, PWRD reported great earnings. Yes, it is very unfortunate that the Earthquake in China could have an impact towards Chinese stocks. But I don't think it will be their Achilles heel.

I haven't been looking into too many other names lately. That's because to make money it doesn't require that many. If you can study the trends of a few stocks and nail the entry points. It is all you'll need.

Oil was up in the morning but it is getting sold off. We will see what happens

SOLF getting a bounce today. Once again I have been day trading that stock. The volatility in SOLF is just too good to pass up. 75% of my gains from the week had been from actively trading my positions in and out. This past Sunday when I was sitting down to study SOLF I vowed to myself I will stick with the plan and execute everytime with conviction when opportunities presented themselves. I am glad I did.

Let's see what happens at the end of the day.

-DL

Disclosure
Long GOOG, 75%V, 70% PWRD
Short USO

UPDATE 1:
Markets ended at the lows of the day, concluding the first week of major losses across all indices. What can we expect next week?

S&P 500.


Even though this market will most likely continue to have a downtrend direction, as we know by now nothing ever goes in one direction in a straight line. After a week of heavy selling the S&P 500 is now about 4 points away from the 50DMA which should for the time being provide strong support for an oversold bounce. So keep that in mind. Or who knows, maybe the big money will just continue to slaughter the markets silly. But recall when the markets were going up big, there would also be pullback and slightly down days to regain momentum before the next leg up.

The same works for a downtrending market. After multi day selloffs it is very likely we will see a bounce. Don't trust it for too long. But at the same time, don't go piling in hand over fists on the short side in the beginning of next week just because the selloff that ensued this week. You could get whipsawed out, and that's never fun. Always think it through.

I am going camping this memorial day weekend. Monday there is no trading so I will talk to you all on Tuesday. Have a good weekend and enjoy yourself.

-DL

Disclosure
Long GOOG, 75%V, 70%PWRD
Short USO


Thursday, May 22, 2008

New Technical Indicator - Market Velocity and Force Meter

I am pretty excited about tomorrow because the Scottrade Elite platform just had a nice upgrade. There is now a new tool call the Velocity & Forces meter.


My preliminary impression of the tool is this will be a graphical interpretation of Level II information. It will show the buying/selling force of any stock and will also indicate the velocity of the buy and sells. It calculates the information by the second, shows the current stock momentum, and the actual volume of sales.

Looks good! If anyone is currently using a different brokerage platform and have something similar to this tool, please share your experience and your thoughts about its effectiveness. Would be nice!

$$$$$$$$$$

OH YEA! SOLF IS MONEY IN THE BANK!! I hope yall got in on some yesterday! I rode this badboy down from 28 to 23. Done deal! It could probably go lower, but I am folding.

MXC - TALK ABOUT BUBBLE BURSTING! CALLED IT! FUN'S OVER! SUCKA IS TANKING MAD TODAY DOWN 23%. I am going to trade aggressively today on MXC and PDO

It's been a very exciting first hour. We are getting a small oversold bounce today. BUT DON'T TRUST IT. You have to be ready to expect after the massive move we've made up the past 2 months that we will see more selling pressure. Stay sharp!

-DL

Disclosure
Long GOOG, 75%V
Short MXC, PDO, USO


UPDATE 1:

I'm done trading today. Covered all of my MXC and PDO shorts. I need a breather my adrealine is kicking hard. For those that say stock trading is not a good thing, or for those people out there that don't follow the investment world - I wonder how they would feel knowing we can make their monthly salary in mere hours :)

Charts tell the truth. I am a true believer, and so should you!

And by the way, keep an eye out for Visa. Let's see if we can pick it back up in the near future for 75

Disclosure
Long GOOG, 75% V
Short USO

UPDATE 2:

Keep an eye out on PWRD. I am setting up a buy order @ 25 for a 50% position. The sell volume is starting to diminish. We could see it sell off by the end of the day on light volume but if it touches 25 it could have a nice reversal bounce. I think it has been killed enough at this point.

UPDATE 3:

PWRD order filled @ 25. Closed today at 24.95 I am feeling good about this buy. If it tanks more tomorrow I will continue to build position. Let's see if it'll hit 24.5 tomorrow.

MXC and PDO .... MURDER SHE WROTE. That's all I have to say about those...

SOLF got killed bigtime today. Almost 3 bucks below my cover point. Wow. Oh well, I made my profit, I am content. If the stock breaks below 20, watch for it to pull back to its 200DMA near the 17~ level. I would probably be a buyer of the stock again at that point. And how bout them goldman sachs analyst...telling people to sell but never told anyone to buy when the stock was way down. They are so late to the party :)

USO coming down some. Encouraging indeed.

Today was one of my biggest % gain YTD. I am very happy and content. I probably will do less aggressive day trading now though for the time being. Don't want to be stupid and give all my gains back. Watch for the markets to potentially continue to tread up on light volume due to upcoming memorial day weekend. But remember, if you want to play the little bounces, be sure to USE STOPS! I can't emphasize it enough. Unless you want to be investing in the long haul (like how I do with Google and Visa), don't be overly bullish and buy stocks hand over fists right now. It could be very painful.

On the run again today. I will be back later to post tonight. Have a good one.

-DL

Disclosure:
Long GOOG, 75%V, 50% PWRD
Short USO

Wednesday, May 21, 2008

Potential oversold bounce on the way?

Well, those of you that have been following my blog knows I've been calling the markets to correct sharply. And today the culmination of oil hitting a new historic high coupled with the fed stating they are done cutting rates finally did the trick.

I think tomorrow and going into Friday because it is memorial day weekend we could potentially see a small bounce on light volume. If you are going to be playing any oversold bounces be sure you keep that stop in place. I don't think we are done going down yet though - Not even close

I mentioned yesterday I would be all over the SOLF short should it pop due to earnings and that's exactly what I did. Shorted it right in the morning at $28 so I am up comfortably right now. Tomorrow we could see some more profit taking come in. If you are on the short trade like me, watch these levels of support:

S1 $24.77
S2 $23.04
S3 $20.84

I am on the run today. Invest wisely and be careful out there.

-DL

Disclosure:
Long GOOG, V
Short SOLF, USO

Tuesday, May 20, 2008

MXC and PDO - Ticking Time Bombs Ready to Blow

Look at these two companies Mexco Energy Corp (MXC) and Pyramid Oil (PDO)

MXC


-MXC a mere ONE MONTH AGO was a 5 dollar stock that have EXPLODED EXPONENTIALLY all the way to the close today of $42.53. That equates to a near 700% INCREASE

PDO


- PDO in the last month have gone from 5 dollars to the close today of $22.85 = 381% INCREASE

If these are not bubble status stocks I don't know what is. Especially MXC.

Keep in mind these are small cap stocks and could have very unpredictable moves. But I am about ready to jump in on the shorts because when the profit taking comes in full gear, THESE STOCKS ARE GOING TO DEFINE THE MEANING OF A BUBBLE EXPLODING.

Watch these two plays in the days to come.

- DL

Market Update, PWRD, SOLF, OIL

Well the markets really sold off rather steeply today. The Dow was down 200 points to close @ 12,828. The Nasdaq down 23 points @ 2,492. And the S&P down 13 @ 1,413. Oil today hit another all time high to close @ 129 dollars. And the PPI data released confirmed the threat of inflation...

All that is jibberish in my opinion. Want to know the real truth? As I have said before in the past, the markets follow TECHNICALS. Even though the news feed is important, in my opinion it's just a cover, or better yet, catalyst, to give the markets the extra little push to buy/sell. Following technicals is much better than listening to headlines and the Wall Street media BS. If anyone listened to those clowns a few days ago (I like Jim Cramer because he is the ultimate contrarian to market sentiment), they would have been another victim of the "retail investors getting robbed by wall street" statistic.

PWRD - A stock I've pounded the table to short when it hit $30 bucks and beyond, got annihilated the past two sessions. I hope some of you hopped on the short bus and rode this baby down - congrats to you on making nearly 20% in two sessions. But watch out now for a potential rebound in the making.


Since the bulls took it on the chin pretty hard the past two sessions, we are likely not going to see this IMMEDIATELY rebound. With that said:
- Indicators are nearing oversold status.
- It is currently at the 50 and 200DMA. Even though from the first glimpse it appears to have pierced those averages, be careful of the potential fakeout.
- Note the "M" pattern that formed perfectly from the price action.

PWRD closed at the lows of the session, so tomorrow we could continue to see even more selling pressure come in. But if you are short, that would be the opportunity to start locking those gains in. Pay attention to these 3 support levels (I'll name them S1, S2, S3)

S1 - $24.91
S2 - $24.26
S3 - $23.06

Compliments of the Mojo Pivot Point Calculator.

If the stock continues to selloff tomorrow, consider setting your cover at these targets. If you are looking for an entry point to go long, consider these to be the targets you would want to start building long position. The numbers are calculated based on today's Open, high, low, and closing price.


SOLF
- We didn't see too much action today because the gigantic move it has already had. They are set to report tomorrow morning. I do not have a position into earnings but if you do, I wish you the best. It will probably come out above analyst estimates (and it better). If it blows out by a huge margin the stock could have another gigantic short squeeze that'll push it up bigtime.
(35% short interest according to ShortSqueeze.com )


But if they disappoint in any way, or just comes in line with expectation. You better believe the bears are going to come stampeding to take the "fun" out of SolarFun. JUST LOOK AT HOW EXTENDED AND OVERBOUGHT IT IS! If I had to guess, I'm going to say they are going to have a sell the news plunge tomorrow. If it pops big tomorrow I am going to go on record now and say I'll be all over the shorts.


Oil
- Yes, once again, oil makes another historic high. Today I think based on comments made by an oil mogul Boon Pickens who initially said oil was a short at 100, but today on CNBC reversing his stance and going long.

USO rallied another $1.5 to close at 104.30. Very impressive indeed. But I am going to continue to take the contrarian view here and say oil is due for a very sharp correction. Whenever there are "moguls" coming out proclaiming IN PUBLIC they are going long, when we have Goldman Sachs raising their targets, and when we have the news channel every single day pounding the table to go long oil, that to me is the indicator to sell. The big money is probably still bidding up the stocks to try to get as many retail investors on board to go long. And then in one swoop they will take them all out hard and fast.

I will not go long oil here. Am I losing money on my oil short? Ya I am...down 4.3% to be exact. But I am very convinced this move will be coming to an end soon. There's simply too much publicity about this right now, the technical charts are way over extended, and the sentiment is way too bullish.

So if you're considering going long oil, be sure to keep stops in place to protect your profits. Take the lesson in Gold and what happened when the price was at $1,000 everyone said "$2,000 gold here we come!" And then gold subsequently took a ~$150 nosedive.

Invest wisely. And always remember - Charts tell the truth.

- DL

Disclosure:
Long GOOG, 75% V
Short USO

Monday, May 19, 2008

My Trading Platform

I've got a few readers that emailed me or left a comment interested in knowing how I setup my trading platform. So here it is.

When I trade I run my tools on two laptops (Scottrade Elite), one on desktop (Charles Schwab StreetSmart Pro), and I have the TV flipped to the business media channel (Split PIP with Bloomberg and CNBC). So altogether I have 4 screens running simultaneously.

On my first laptop I setup the screen to monitor the daily indices movement (This is Scottrade Elite)


I can maximize any screen at any time to look at the Dow, Nasdaq, and the S&P. In the middle is the day's most actively traded Spiders which has every single sector's index on it. They provide a great indicator of the sector strength during the day. On the top I also have a quote grid which has my top 20 most followed stocks (all the numbers fluctuate live during the trading session)


Here is the second screen.


My second screen is the Market Statistic screen. Here I can see decliners vs advancers on all the indices as well as market breadth (VIX meter and all that goodies). There's a lot more to it but the page is not big enough to show everything here. These indices update live during the trading session. I can also read market news, sector news, fixed income (bond yields), etc. This provides vital information to the health of the market and throughout the trading session I pay a lot of attention to this screen to determine market sentiment.


Here is the third screen


This is my main Technical Analysis page. Just like all the other ones I can maximize any screen I want to have a full expanded view. At the bottom is the streaming news. Anything new happening with any stock during the course of the day will immediately be updated there.

The middle screen is a live Level II ticker of the price action. Bid/Ask prices and their quantities are all shown there.

The top screen are the in depth numbers of any one stock I am observing. Note all of it changes in real time when the markets are open.

And on the right is my TA setup. I use a 2-day 10 minute intraday chart. What this means is every "candle" on the chart represents 10 minutes of time. While it is also important to have an expanded view of the stocks (which I can easily change), I focus primarily on this setup when I'm swing/day trading.

The technical indicators and tools I use are:
- 20, 50, and 200 DMA
- Bollinger Bands
- Volume
- Momentum Indicator
- Stochastics Slow
- Relative Strength Index

I don't use the MACD because that is a lagging indicator during a trading period.

When I need to execute orders, I don't have to go through a confirmation screen. What I do is I select order entry, I type in the stock I want and the quantity, and then there are 4 actions I can take. Buy, Sell, Buy to Cover, Short


So basically, If I want to buy the stock, I press the buy button and my order will immediately execute. Same with all the other function. I can also set limit orders, stop loss prices, breakout buy, trailing stops. All are available there. The response time on Scottrade is very fast. Usually within 2 seconds my order will execute.

When I execute an order, there will be a log that shows my trades along with the time stamp, the action I took, quantity of shares demanded, and whether the trade was executed successfully. Here are some of the trades I did today.


Even though Scottrade doesn't provide all the premium services more expensive brokerages will provide (Schwab, Fidelity etc.,) you can't really go wrong with $7 dollar trades. And honestly the trading platform in my opinion is second to none. Not even the Charles Schwab platform is as good as this (which is what I run on my desktop). The only thing that Scottrade lacks is the independent research on stocks. This is where Charles Schwab excels because it has Goldman Sachs, Argus, Charles Schwab Report, Reuters, VIX report, and the S&P report. All for free. VERY VERY good analysis.

It's hard to show everything the Scottrade platform does though with only 3 screenshot. You have to see it for yourself. But in my opinion, this is a very respectable platform and should provide sufficiently everything you need to trade.

SOLARFUN $$$

I am loving SOLF!

Even though I did not enjoy all the gigantic moves it has made the past few sessions, the mere intraday volatility makes the stock very profitable!!

I must have traded SOLF over 10 times today (long and short) and still doing it right now. As of last tally I am up about $2,000 in the past 2 hours. Not bad at all!

Take advantage of these stocks when the volume is at its biggest. USE TECHNICAL ANALYSIS TO IDENTIFY BUY/SELL POINTS! This stock is money in the bank right now. Stay quick on your feet folks.

The key to successful day trading though is CONVICTION. Keep your losses small, and know when to lock profits.

Plan the trade, trade the plan.

- DL

Update 1

SOLF is VERY STRONG at its intraday 50DMA. But be careful about holding overnight positions. Tomorrow since it is the last day SOLF will trade before its earnings, the moves could be enormous both ways. It could tank because the stock has already made a huge move. Or it could rocket some more because investors are piling in and potentially causing more short covering. No matter what, STAY DISCIPLINED, and USE STOPS to trade.

Gotta be honest, I haven't had this much fun trading in a good while.

Update 2:

I am done trading SOLF for now. Long and short I count 22 orders executed today. I am not going to hold an overnight position. But tomorrow I am expecting the stock to have just as much volatility and swings. Stay sharp folks!

- DL

Disclosure
Long GOOG, V
Short USO

UPDATE 3:

SOLF JUST BROKE THE INTRADAY 50DMA. IF YOU ARE TRADING THIS STOCK, OR HAVE GONE LONG SINCE LAST WED. NOW IS THE TIME TO GET OUT AND LOCK PROFITS!!

If you are short, this could be tasty!!!

Update 4:

Wow PWRD down $4 bucks today to $27 - Pretty much spot on where I thought it would tank to! Congrats to you if you have been making the money on this trade. Tomorrow PWRD would probably sell off a little more because it closed right at the low of the day. But starting tomorrow, if I were you, I will start locking in profits. Whenever you get big moves like this, you have to stay discipline and do the right thing. Don't worry about losing out on more potential profits. You've made it already!

Markets had a VERY BIG reversal at the last hour. Watch for the potential downside that may come in the days ahead. For the DJI and S&P, they have once again tested the 200DMA and the sellers came in and dumped hand over fist.

Invest wisely - don't be the person to pick up wall street's unwanted shares. Save that for the Cramericans! BOOYAH!

Sunday, May 18, 2008

Sunday Night

Back from an exhausting but amazing weekend. Now it's time to get ready for the new week to come.

What is this weeks theme? In my opinion, it could be the beginning of the downfall I've been anticipating (since now option ex week is over).

All the major indices are very extended from the March Low's. Oil are hitting new highs everyday. And the business media buffoons are ALL resoundingly bullish. Everyone is saying "buy stocks buy stocks!" To me, the ingredients are really adding up now to the calm before the storm.


I want to talk about a few ideas I have been thinking about - First is oil.

Oil has been on an absolute tear but the price action now seems to increase due to inorganic inflation of the prices. Hedge funds just pushing the oil trade up and up refusing to let it sink. But looking at it from a technical perspective, the price action we are seeing in oil is one of a topping formation.


I am bearish on oil for the near future because:
- The stock is now trading in a sideways channel, with a double top formation appearing.
- Indicators are maxed
- THE MEDIA IS POUNDING THE TABLE FOR PEOPLE TO BUY. Usually when this happens, it is because wall street wants average investors TO BUY THEIR SHARES WHILE THEY UNLOAD HAND OVER FIST.
When there are too many people piled on to a trade, it usually means an imminent reversal will happen. It is only a matter of time. I have been Short USO since 100 and even though it has had some impressive moves up it still will not go over 103 dollars.

We are suppose to buy stocks when it is down, NOT WHEN IT IS UP. Stay disciplined and do not let the wall street jibberish suck you into buying this stock now near its all time 52 week high. It is due for a big pullback. Remember, all the news the media reports ARE AFTER THE FACT. By the time they tell people to buy a stock that means the move has already been made.


2nd - SolarFun Trade.

So last Wednesday I noticed a breakout in Solarfun (SOLF) but did not have enough conviction to jump in on a trade when it was at 17. An opportunity lost because I have subsequently missed out on a 30% move. But what's done is done, this is how I'm setting up for the next move. Keep in mind, EARNINGS for SOLF is coming out on 5/21 morning (so last day to trade it before earnings is Tuesday).


SOLF for the short term is extremely overbought. It has ramped from 12.72 all the way up to 22.84 in a matter of 2 weeks. It went up 53% alone the past 5 trading days.

My hypothesis is should Oil start pulling back next week, alternative energy will also take a subsequent hit. As I've noted before, SOLF is a very high beta stock that can easily give back gains as fast as it gets them. I don't expect it to pull back all the way to 12 dollars. But if the stock pulls back 50% from its recent gains, that would equate to 22.84-12.72 = ~5 dollars

22.84 - 5 = $17.84, which would still be comfortably higher than where its 200DMA is. And if SOLF pulls back to that level it would actually be VERY BULLISH action for the stock.

I think another reason why SOLF went up so much recently is due to Short Covering. Earning reports from other solar companies such as FSLR, SPWR etc have absolutely destroyed the bears. And consequently right now it is causing shorts of SOLF to cover aggressively to prevent themselves from being stuck in the trade.

But the stock has ramped so far up now that it could allow for a "sell the news" result. I am not an advocate of owning a position on any stock into earnings. But if the stock jumps big after the earnings report, I will be all over the shorts. If the stock tanks, I will be a buyer. Keep an eye out for SOLF both long and short... it should be a very interesting, and profitable stock in the near future.


I am currently starting to explore a new method to analyzing stocks by calculating "pivot points". I have a pivot point tool that allows me to calculate Resistance and Support level prices. Still in the process of experimenting with it but after observing its results from a few trades it proves to have some validity and merit. If you are interested in it leave me a comment and I'll tell you more.

All in all, with the exception of the Nasdaq which have confirmed a breakout on the 200DMA, both the Dow and S&P are hitting tops on the 200DMA and is failing to break. Given the option ex week is now done with we can see some big money pulled out from beneath us. If you are still in the market to trade on the long side, be sure to stay disciplined and utilize tight stops on EVERY trade to protect profits. There will come a time again to be greedy and buy hand over fist. The important thing right now is to protect as much of that capital as possible so when everyone is jumping off a cliff once again, we will be there to pick up shares at really low prices.

If you do believe in technical analysis like me, I would suggest strongly to start studying stocks that have either made gigantic runs, or are in the sectors most affected by the credit crunch, and utilize the potential downdraft to short.

Stand fast, and let's make some money together.

-DL

Friday, May 16, 2008

Market Morning Update

SOLF...20 bucks+ ...

Another opportunity missed. I played it safe and wanted to wait for a pullback. Oh well, sometimes it is better safe than sorry. And plus who knows maybe it will selloff later this afternoon. I will still be paying close attention to it

USO short is not profitable again...Goldman predicting 140 oil...herd mentality?

Let's see what happens later today.

-DL

Update 1:

Wow SOLF is up 16% today!!! I am slapping myself over and over right now for spotting an opportunity but did not execute my plan. This lesson reinforces the consequences of inaction. Oh well, let's keep an eye out for it. SOLF is actually due out next week for earnings. Given the massive run up we are seeing in the stock, could we be setting up for a sell the news plunge after the report? Let's do our homework this weekend for SOLF.

Markets are pretty much finishing flat. It is still my belief though that we will see another potential leg down. Perhaps this will happen after the option ex (which is today). So be careful and don't get too bullish. When I am watching the business channels now all I see are people being bullish. The Call/Put ratio is absurdely skewed toward the call side (over 3 to 1). So when the sentiment gets this bullish, as smart traders we have to anticipate the moves to come. It is not the time to chase.

Hope the trading week has treated everyone well. I am going to the AMA superbike races this weekend (I am insanely obsessed with motorsports). Enjoy the weekend. When the new week starts, let's keep our eyes open for the big opportunities!

-DL

Disclosure:
Long V, GOOG
Short USO

Thursday, May 15, 2008

Whipsaw Option Ex Week Continues

I didn't do anything today. No setting up for tomorrow, no day trades.

Reason? This week's whipsaw can slam us silly if we are not careful.

Yesterday we saw the nasty reversal in the markets, leading people to believe a selloff may be in the making. That got a lot of bears on board. Bam, today is an immediate reversal to short squeeze and shake out bears once again.

But could this be the tactic to get enough bulls on board to whipsaw them all out tomorrow?

It is too hard to say right now. This is why I just have my cash parked. Whatever exposure I have is what I'll keep.

I am on the run today, I'll update more later tonight.

- DL

Wednesday, May 14, 2008

Market Update 5/14

Another bullish day...the whipsaw continues. I think it is due to option expiration this Friday. As history will show, Option ex week usually provides some big volatility. If you are going to be trading the swings stay disciplined, use stops, and take profits when you have them.

I have recently been looking more and more into smaller cap stocks. This is where the money's at (of course, if we're wrong, then its mega pain).

Well I found out I cannot Short ENER because my brokerage doesn't allow it...but ENER got me interested in a new sector - solar

In particular Solarfun. Keep in mind this is a VERY VERY volatile stock and like PWRD, it is NOT FOR THE FEINT OF HEART. Make sure you examine your own risk tolerance and investment objective before looking into this play.

With that said, SOLF as shown on the charts, have PLUMMETED from its all time high at $40 in January all the way to $8 dollars in middle of March. Unbelievable decline (But for bottom fishers, they have already enjoyed over 100% return on their investment). With summertime approaching this stock has been silently creeping up. And today the most noticeable action to me is the breakout from its 200DMA


Whenever there is a confirmed breakout over a long period of time (this is 3 month chart), that is VERY BULLISH. All the indicators are maxed at the moment so I'm not jumping in yet. But I am paying VERY VERY close attention to it. The stock is up 9% today along with the entire solar sector. Should this pull back a buck or so at around 16 I am ready to dive in for a trade. This stock has very big moves just like PWRD does and I would not be surprised if it even touches 20 in the very short term. Today's intraday high was already at 18.35 so from 16-20 would be over a 20% gainer.

If the overall market indices continue to follow the pattern we've seen over the past few days, today is a big move up, tomorrow we should see selling pressure again. Just my speculation. We shall see.

- DL

Disclosure
Long GOOG, V
Short USO

Update 1:

We had a pretty nasty reversal at the last hour of trading. The volume was light all day and then all of a sudden the sell programs just went into overdrive. All the indices (in particular the Nasdaq) touched the 200DMA, appeared to have pierced it, and then reversed hard into the close. Watch out tomorrow should the sell pressure continue to push on. But if we get too oversold, watch for a whipsaw reversal as well. No matter what happens, if you are trading the volatility, make sure you stay quick and nimble.

Let's see if the SOLF will have a big oversold pullback now. Apple tanked really hard from it's intraday high, same with google, Visa, all the solar stocks. Everything was pulled down. My USO trade may prove to be a winner now. I am feeling good about holding on to it.

Good luck tomorrow

- DL


Tuesday, May 13, 2008

Energy Conversion Devices Inc (ENER) - Shorting Opportunity?


This stock had an amazing week. Shot from a gun at 32 all the way to the highs closing at 55.20> This is one of those Solar plays that have had a parabolic rebound from the abyss since the beginning of the year. But recall First Solar, LDK Solar, Evergreen Solar, Solarfun - etc., after big earnings move up and a few days of euphoria will most certainly have a profit taking selloff. The stock has hit a 52 week high. And when oil recedes in the near future (which I still believe, that is why I have my USO short), alternative energy will also pull back. And stocks like ENER have gone up so much that it is the most susceptible to pullbacks.

If the stock bounces to 56+ tomorrow I believe it is a great profit taking short opportunity. With its overbought signals and the stock reaching 52 week high we could see it fall back to 50 due to profit taking and it could happen very fast. Wouldn't be such a bad trade.

I will initiate shorts starting from 56 all the way up to 59. Looking for it to pull back to 50. 3 dollar downside, $6-$9 upside. Pay attention to this one.

-DL

Market Day 5/13

New day,

PWRD is down $1.30, or 4% as I'm typing right now...I missed the short trigger by 40 cents yesterday. One opportunity lost...I will keep a close eye on it.

Visa is up today. It is now resting on top of the 20DMA and solidly over the 50. We should see good support for the stock even on down days (such as today).

This is what I'm talking about though...the markets will jump up huge to get as many bulls on board as possible, and then reverse the other way back. We are most likely going to be stuck in a ranged trading on the indices (at least for the Nasdaq and S&P). The Dow is interesting however because it is right now on the 20DMA and it's looking like the support may break away. With the 200DMA right on top as heavy resistance we could see a lot of selling pressure coming in.


The thing to keep an eye out for right now is how the technical indicators have receded already well off its highs. So a rebound is critical, but given how the 200DMA is coming down, it might be a very big challenge to get the Dow Jones moving up. 13,000 is going to be a tough resistance to get past.

If the markets are meant to go down, then it all comes down to stock picks and sector choices. Just because the indices go down doesn't mean every single stock goes down with it. Pick your spots and stick to the discipline.

Let's see how the day unfolds.

-DL

Disclosure
Long GOOG, V
Short USO


Update 1:

USO just spiked bigtime very impressive action. I am down a couple bucks on the trade but my position in the short is small. Contemplating on adding more to it...

Update2:

Wow did I miss out on the PWRD short, down nearly $2 bucks at the lows of the day! The stock is now right below the 20DMA, on any fakeout strength tomorrow I'm going to put on a short and ride it potentially to 26. This one could be a big winner, pay attention to it.

Update 3:

I am selling some Visa today (Just a small portion) to lock profits. I have absolute conviction to the stock, but at the close today I noticed a very disturbing chart pattern forming...so I could potentially be buying at a discount. I know I said it'll hit 100 and I still believe it will, but in addition to the position I'm holding in my IRA I intend on trading around the volatility as well.


Note this is a 2 day 10 minute intra day chart.

- Negative momentum forming
-Confirmed breakdown from moving averages (There is no bottom after this until all the way to $77 - the 20DMA from a 3 month perspective). And it is going to take the 20 and 50DMA a few days or weeks to reach back down to the high 70's to act as support.
- Extremely light volume trading (notice the near non-existent bids, but note the final 20 minutes of trade that showed increased volume selling.)

So I still have a position left in it, but being a swing trader I have to keep it real. The point is to lock as much profit as possible and utilize every advantage we have to beat the markets. Even though I like the company, they're still after all just a money making vehicle. I have no emotional attachments to them. So if I am wrong, I will still profit from my existing position. If I am right, then I will be able to buy this great company back at an even greater than anticipated discount. My first buy was at 72, last buy was at $79. I locked profits near the close of the day @ $82.30. So $10 profit locked. Not too bad at all for a trade I've had since 5/1/2008 (12 days).

Let's see if Visa will retest its 3 month 20DMA or even lower. Thats when I will look to pull the trigger again.

I'm curious as to how some of you readers thoughts are about the market. Please share with me your insight. And let's make some money. If this year so far have taught us anything, it is the markets are more volatile than ever before. And as long as we accept both the bull and bear story and be smart about our executions, we will have the opportunity to make double the returns or better yet save ourselves from the pain of seeing gains evaporate.

Monday, May 12, 2008

Market Day 5/12

New week, it's time to work it again.

I've increased significantly on my position in Visa (V) today during its monster dip in the morning @ $79. Coming off a $12 dollar pullback I think this is now the point where we can start building position for the future. I am a dip buyer now on any further pullbacks. I think the stock will hit $100+ within the next couple months. ~22% return isn't too shabby at all. And as I've stated before in a previous post - I used to be a former employee of Visa and I truly believe in the company's prospect. Visa have been doing some major restructuring lately and all of this should help the company streamline its business and increase its revenues even more. Let's see what happens.

Besides that, I haven't done much this morning. The markets are now in a see-saw pattern. Up one day, down big the next, then rebound. Cycle repeats.

I am still waiting on apple to take a hit before I jump in again.

PWRD...the stock shaved a dollar off its highs today...With the Earthquake in China that struck over the weekend I'm wondering will that have any affect on the Chinese ADR's? Have to do some quick constructive thinking to decide if i want to put on a short position again.

Disclosure:
Long GOOG, V
Short USO

UPDATE 1:
I am setting up triggers to short PWRD @ $31. This is where both the 20 and 50DMA is at and because the stock is now retracing back up on very light volume it makes me believe it is setting up perfectly for the next leg down.


Note this is a 4 day chart.


Thursday, May 8, 2008

Market Update 5/8

We are getting a temporary reflex rally today off the plunge the market took. Nice opportunity to set up some shorts and book profits at the same time.

I have covered my entire PWRD position this morning on a trigger @ $28. I didn't think it was going to go that low but apparently it went to $27.40 at its lowest! But judging from where it is now I'm glad I locked profits. No one ever made a dime being greedy in this market. The stock is bouncing off its 20DMA on big dip buying programs kicking in. But to be honest, the way PWRD chart is setting up makes me inclined to short it again. It is recovering right now from the lows and about to hit the 50DMA with the technicals near maxout. I'll decide what I want to do.

I mentioned the Oil fund etf USO in my post yesterday and today that trigger kicked in at $100. EXACTLY where the USO topped out not a penny more. It doesn't get any better than that! Going to ride it for probably 5-6 points.

-DL

Edit 1:
I've thought long and hard, and for now I'm going to release my apple position. There is nothing wrong...except it has just simply made too big of a run to a point which I cannot ignore the potential downside it may have. At its highest apple hit 188. If Apple has a 50% Fibonacci retrace from it's low of 115 hit during this year, that would mean 188-115 = 73 points / 2 = 36.5 points pullback possible. Meaning 188-36.5 = $151.5.

Which matches exactly what the charts show


Necktie support EXACTLY at 150 from 3 year perspective.

Am I being too pessimistic thinking apple will retrace that far? Maybe...but Apple has made a very big move up. It's just not realistic to keep expecting it to keep going up without any profit taking pressure. With its indicators near max out in the short term plus my belief the markets will continue to correct, I wouldn't be surprise if I could pick this back up again in the 150's. So I will do the discipline thing and book profits. I will be back.

Disclosure
Long GOOG, V
Short USO

Wednesday, May 7, 2008

Here Comes the Market Turn

See what happens when too many people keep getting suckered into going long? Institutions will just smile and sell blind bulls their shares while the average investors suffer the pain.

I've posted last Friday the imminent correction the market must endure once again. And today it is starting to show steam. Indices as of 11:35AM PST is down about 2% across the board.

I have sold my remaining 25% MOS position into strength this morning at about $128. I'm going to wait until it goes below $110 before I jump back in.

My PWRD is now a big winner it is down another 4% today. Close to my cover mark. But I will let it ride for now.

AAPL taking a little hit, same with GOOG. But I'm a buyer of weakness on their pullbacks. But not yet even these guys have ran too far.

I am ready to increase my short positions when theres any sign of small strength up (for example like yesterday, we rallied big off the lows and blind bulls thought that was the end of the correction and bought in, they are feeling the pain today).

Be careful out there now. This is not the time yet to be a hero and jump in long. We're staring a long way down.

-DL

Disclosure
Long AAPL, GOOG, V
Short 2x PWRD

-PS Oil is performing once again on a huge down day. But I believe the steam in oil is about to run out as well. Take a look at the USO oil ETF fund. It is topping out near $100


Consider also
- The crude inventory report that came out today which stated more supply has been injected into the economy the past month
- The dollar potentially strengthening again on the speculation of the fed is done cutting rates
- Gigantic run it has made
- The heavily biased bullish tone people have on oil

All makes me believe oil, and this fund, will have sharp corrections so fast longs will not even have time to react to sell their shares to lock profits. As the first line of support, USO could correct to $93. Then depending on the overall macro effect we could see it test its 50DMA as well. Keep in mind, these are trades, not investments. I will be paying very close attention to this fund. And my plan right now is to initiate short positions on it should it hit par ($100)

It is at $99.70 ...not that far away.

-DL

Tuesday, May 6, 2008

Market Update 5/6

Second trading day of the week, and the second consecutive down day we're having.

Even though only 2 days of correction, I feel this retrace will have some legs, given how far we've gone up.

UBS writing down jobs, Fannie Mae reporting losses, all just further proves why WALL STREET MEDIA ARE SO UNETHICAL WITH THEIR BULLISH CALLS (Cough CNBC Cough Fox Business News). They kept telling people last week things are going to just keep going STRAIGHT UP so don't even wait another damn second and just pour your money in!.....

PWRD is pulling back this morning. Down 6% as I'm typing this. I'm smiling real pretty right now. Lesson learned for me, Trade my technicals, not by emotions. Patience is paying off. I will be watching this closely. Since I tripled my position yesterday I have already reversed my losses and I'm actually up on the trade. So if today the stock tanks below $31 dollars I will probably release 1/3 of the position to lock some gains.

I must say though the bullish sentiment still lingers, it seems at the moment people want to jump in on dips and buy aggressively because they don't want to miss potential moves up. But I'm going to take the contrarian route for the moment.

Back to trading. Good luck today everyone.

On a final note, I am so impressed with the performance of Visa and Mastercard. These guys seem to just be chugging along everyday.

-DL

Disclosure
Long AAPL, GOOG, V, 25% MOS
Short 3x PWRD

Edit 1:

-As I've stated from this mornings post, If PWRD hit below 31 today I'd release 1/3 of my position due to cover trigger. That just happened. Nice profit. My next cover target is anywhere below $29.50 I doubt it will tank that much today. So lets see what happens tomorrow.

Disclosure
Short 2x PWRD

Monday, May 5, 2008

Market Update 5/5

Another new week...and although the indices are down today, I am getting kicked in the balls!

PWRD is now up nearly 4 points since I first spotted it as a potential shorts. It is nearly at 33 bucks now wtf! I still have a short position on it but I'm getting hit pretty hard...Wow

Losing it a little bit here...and just frustrated. That is 3 bad picks I've had in a month. And all because I was too pessimistic about the market. (All my losers were short positions). Am I being too negative about the market? Are we really out of a recession already???

Reflecting...

EDIT 1:

MY LOSS IS YOUR GAIN. LOOK AT THE PWRD TECHNICAL ANALYSIS BELOW.


- Notice how there's been 5 winning sessions on PWRD followed by one huge buy candle that's significantly higher than everything else. BUT THEN NOTICE THE SUBSEQUENT DAYS THAT FOLLOWS IT.
-RSI is at near 6 MONTH HIGH
- All other indicators are at max out
- The highest it can go is probably 34 at this point. But this one is going to plummet back down to at least the 20DMA ($27)
- If we sell off today hard, that means Asian markets will follow suit. Which means by tomorrow PWRD will start to tank.

I AM TRIPLING MY POSITION. SHORT THIS BITCH. IT IS TIME TO TAKE A STAND!!

-DL

Disclosure:
3X Short PWRD

Friday, May 2, 2008

Market Update 5/2

Can it really be this easy? The indices looking so rosy everyday and keeps shooting up?! Can it really be a bull market from this point forth with nothing to worry about?

I DON'T BUY IT FOR A SECOND!!

Dow jones chart


S&P


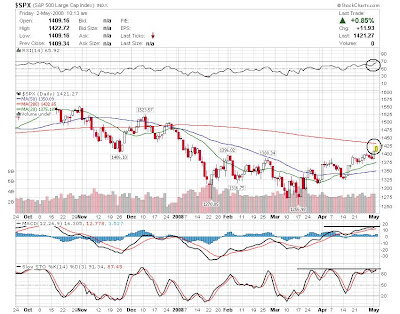
WE ARE NEARING A TOP. I DON'T BUY THESE RALLIES AT ALL. I strongly feel any new money being put long at this point is suckers money. I am growing more and more bearish everyday.

I predict within the next 3-4 sessions we are going to get some piece of news that'll send us lower. Indices have hit the 200DMA. But the first test into a moving average resistance will almost certainly fail. And that is when we are going to have that selloff back down (at least 50% retracement of gains I believe)

Thursday, May 1, 2008

Markets 5-1-2008

New Month. New beginning.

The sector rotation is now in full swing effect. Look at AG, OIL, COMMODITIES, RAW MATERIAL stocks. ALL CRATERING off the expectation the fed is done with cutting rates and thus the dollar have seen the bottom. Don't know about that...but for now money is pouring out of those names.

Look at MOS and POT...absolutely annihilated the past 4-5 sessions. POT dove from 215 to right now at 176. MOS from 140 to 116 right now. I honestly hope no one bought at the top due the media hype.

Because from technicals it was just way overstretched. I saw that from a mile away.

But now, they are getting close to hitting their 50DMA. And that has proven to be very strong support. Observe


Mosiac have been a huge winner. But people that have been following my blog knows I've been selling this hand over fist when it was nearing its peak at the 130+ levels. It has now corrected sharply but watch for the key level at around ~$110. That would be its 50DMA level and for the past 2 years it has not fallen below that level.

I still believe there a major food shortage in the world because I see it myself when I buy groceries. Rice prices have skyrocketed, same with wheat, same with dairy products. Everything is going up. And the fed's continuation to cut rates certainly isn't going to do it any favors.

I am a buyer of my MOS position again anywhere below $110. BE PATIENT WITH IT.

The same holds true with POT. 50DMA is at high 160's. We can probably pick it up at 165.

The tech trade continues to work...I'm a little concerned now about apple though...but guess I'll jump ship when everyone else jumps. For now I'm going to enjoy it.

PWRD is up nearly 6% intraday! I'm adding the other half of my short position in now at $30.35
My stop loss isn't far away though tank baby tank!

-DL

Disclosure
Long AAPL, GOOG, 25% MOS
Short PWRD

Update 1: I am getting ready to buy more Visa (V) for a long term play. I forgot to blog this but I have decided if I'm going to own a financial stock, this one will be it. Reason being
1) It is purely a paper to plastic play
2) It has long term global growth potential
3) It is twice the size of Mastercard (MA) which have now more than quintupled since it's IPO
4) During recessionary eras, people will try to defer payments as much as possible. So they will swipe their cards. And what will they be using? A Visa or Mastercard.
5) I was a former employee of Visa. And I know their business models are very successful.

Yes, it is a little high now because it has ran up huge. But this one is not done going up. I believe it'll at least double by the end of the year. So it's time to take a stance. I waited initially for this at the 50's, 60's, and the only opportunity I got to buy this was during the selloff window it had after its earnings report. But this one should keep performing nicely. For those of you that are patient, you can wait for it to return to ~70 before buying. That is where the 20DMA is.

Disclosure:
Long V