Friday, May 30, 2008

JCREW Fire Sale = Our Opportunity

JCREW (JCG) Getting ANNIHILATED today. It hasn't seen this type of fire sale the last 12 months! Hell take that back, it hasn't seen this type of fire sale since its IPO! Look at the volume bar! That's what I call M U R D E R E D. But this is so overkilled that I believe we can buy it for a quick scalp.


- Note the double bottom that is holding since the January Lows

I am buying it for a trade right now at $37.35 going to ride the reflex bounce potentially back up to $40~

Let's see if it'll work out.

I am selling half my PWRD position @ $27. Made nearly 4 points on it. No one ever made a dime being greedy. So it's time to sell.

Markets are setting up now perfectly for the next leg down. If you are long stocks, pick your spots and stay disciplined!

- DL

Disclosure
Long GOOG, 75% V, 35% PWRD, JCG
Short USO

Thursday, May 29, 2008

Sell into this Rally

Charts show markets have retraced back up since the plunge but now right below the 50DMA. The bounce should be coming to an end soon. If you have been trading the long side, in my opinion consider to start selling.

I have not been trading too much the past few days. There are some personal matters that I have to attend to so I'm not able to trade or update the blog too much. Good luck everyone.

-DL

Wednesday, May 28, 2008

Watch the PWRD pullback

I am on the run again today so I will do my post later this afternoon. But if you have been trading PWRD with me, congrats to us we are up nicely now. Watch PWRD potentially pull back though if it doesn't clear the 50/200DMA from a 3 month perspective. However, if it does pull back, this is the point in my opinion to add position:


Watch the $25.27 "Necktie" intraday support. when two MA's converge together like that it is usually very strong and not likely to break.

Good luck today. Invest wisely and be careful out there.

-DL

Disclosure
Long GOOG, 75%V, 70% PWRD
Short USO

Tuesday, May 27, 2008

How I Daytrade

So I have a few readers interested in knowing how I daytrade SOLF and how to look for entry/exit points. It is tough to explain with text and honestly if I had a way to post videos instead it would be much easier to understand. But here it is to the best of my knowledge.

Day trading is about understanding price, pattern, time, and volume at a specific moment and then utilizing indicators to predict the potential future movement of the stock. When I day trade, I first study where the stock has been. To do this, I pull up a 3 month daily chart - That is the daily movement of the stock price for the past 3 months.
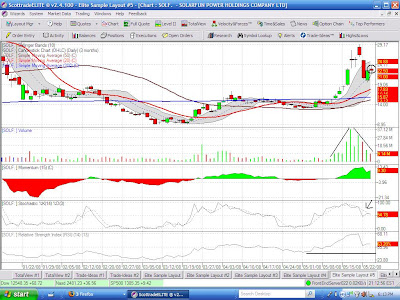


From a 3 month chart, the amount of volume in the past couple weeks is unmistakably higher. More volume = more volatility.

throughout the past week SOLF has made a gigantic move up since its breakout from the 200DMA (remember my post about that from a couple weeks back?), topped out near 29, and have sold off. It has then subsequently touched the middle bollinger line (the dotted line within the shade), and bounced. Since the price level of the stock is now currently below the upper bollinger line, I will reasonably expect the stock to once again hit resistance as it reaches there ($24.88).

The stochastics tell me the stock has a big potentially to continue down because the solid line is trapped below the dotted line.. When the solid cannot breakout from the dotted, it is a bearish indicator.


Now lets look at the 2 day 10 minute chart.


Reading a 10 minute chart is almost identical to reading wider time scale charts with a few exceptions - more emphasis needs to be placed on technical indicators as well as the price pattern that is forming. The indicator I pay attention to the most is the stochastics. During the intraday if the stochastics reaches 90-100 percentile, that is my target to put on short positions. Notice as the stochastic started coming down the stock tanked with it.

The price pattern is even more important. Notice where I boxed the bottom and top of the stock intraday. During the bottom, we see the stock touching the 50DMA and bounced. The reason I know it bounced is because of the "bottoming tail" that emerged. This means, during the 10 minutes when those bars were active, the stock got sold off to that level and when it touched the moving average buyers came in and boosted the stock price back up. When you see multiple bottoming tails (stock has to close in the top 25% tier of the candle), along with the stochastics at the 10-20 percentile, THAT IS THE SIGNAL TO COVER SHORT POSITIONS AND GO LONG.

Notice also during the very extreme of the selloff, the momentum indicator also shows a severe bias towards the red side, when that occurs, it is also the signal to cover.

The same with topping action. Notice the top box I drew in. When the stock is starting to top off, you will see the stochastics reaching 90%+, you will see the momentum indicator skewed towards the green, and the most important would be the "topping tails". Just like a bottoming tail, a topping tail occurs when the stock gets a bid at certain prices but cannot sustain. During the 10 minutes when those bars were active, the stock pushed up toward higher highs', and as they got up, sellers came in and locked profits. When there are multiple topping tails emerging (stock has to close in the bottom 25% tier of the candle), along with the stochastics at the 90-100 percentile, THAT IS THE SIGNAL TO SELL LONGS AND INITIATE SHORTS.

Understanding how the chart patterns work is already half the battle. Add all the other technical indicators into the equation allows me to predict with about 75-80% certainty of what the stock will do next. It is not an exact science though and sometimes it is very tough to gauge it during a live session. It is one thing to study the charts now "After the fact" versus trading it live. Even with all these indicators, I still mess up from time to time. Today because I didn't stay disciplined my intraday gains were wiped. But this is my method to day trade.

Finally, the Level II stream as well as the velocity meter provide great tells to the stock momentum and is vital to day trading. It gives day traders very good ideas the amount of bids being queued on the long and short side, as well as telling me the intensity of the buy and sells.

Day trading is about putting all the pieces to the puzzle together and being nimble. In addition, the amount of shares you can trade is very important as well. Because the more shares you are able to move around, the less time exposure it is required for the trade. And less time exposure = less risk. Factors such as capital gain taxes and transaction fees also needs to be considered because those are expenses that cannot be avoided. Trading 100 shares of SOLF at 30 cents gain will only equate in 30 dollars of profit. In the scheme of percentage movement, that is a sizeable gain. But 30 dollars of profit subtract on average 15 dollars in transaction fee would mean already half the profit is wiped. Then consider the 30%~ of taxes that has to be paid, it wouldn't leave too much profit left and thus not worthwhile for the effort put in. Not to mention in order for a 20 dollar stock to move 1 dollar will require massive amount of volume. And the longer a daytrade is in place, the more risk it gets exposed to.

But 1000 shares on 30 cents profit would equate to 300 dollars. 300 dollars subtract 15 dollar transaction fees = 285 dollars then deduct roughly 30% in capital gain taxes would still leave a net profit of $200. Now that is more like it. Make sure to consider whether day trading is suitable for you in terms of risk as well as the rewards. Make sure it is worth the effort!

Good luck!

New Week

Had a great weekend, I hope everyone did too. I went camping for the entire weekend so I didn't get a chance to do homework on new stocks. Have some catch up work to do.

Markets are trading flat right now after the morning's rally fizzled. I think we can reasonably expect the indices to have a day or two of pauses. Last week it went down too fast without any sort of bounces.

PWRD is a winner now once again. Congrats if you bought in on the call (or if you had a fill order @ 24 because that was exactly where it opened).

If you still have it, theres a choice to be made right now (since it is up 5%).

If you believe the markets will eventually take a hit again, and therefore pulling PWRD potentially even lower, then hey, a 5% gain in one session isn't that bad. Or, you can wait for PWRD to rebound to its 200DMA and 50DMA @ $26. Which at that point would be heavy resistance and thus result in another round of selloff.

If you believe even throughout the market turmoil PWRD will eventually retrace back to 30+, then just hold on to it. And maybe set a stop at $22.

I am going to hold on to it for now. I will see what happens when the stock hits $26. PWRD historically breaks resistance very easily. Meaning support usually isn't support, and resistance isn't so either...let's see what happens.

SOLF in my humble opinion is currently one of the best day trading stocks around. The swings are so great yet the market cap of the company is small enough that if you trade anything above 1000 shares you can actually see your buy and sells moving the stock!! It's pretty fascinating. I have been day trading SOLF for a week now and have made a killing doing so. I am going to continue to do it until the trade is broken and the volatility dies out.

Someone also asked me about what I'm going to do with my USO short. My stop loss on it is at $110. If it goes anywhere below triple digits (below 100) then I'll probably cover. I still believe that oil needs to have a very big pullback. But I've had the trade for nearly two weeks now. I feel my money could be put to better use elsewhere.

Let's see what happens later today.

-DL

Disclosure
Long GOOG, 75% V, 70% PWRD
Short USO
Actively Day Trading SOLF

Friday, May 23, 2008

No Mercy Into Memorial Day

Well I thought the markets would be more merciful and just stay flat going into Memorial day. Looks like that was wishful thinking.

As of 10AM the markets are down over 1.2%~ across the board. It seems like wall street wants to reduce exposure going into the weekend.

My PWRD position getting dumped hand over fist. Stock is down another 5%. I am adding another 20% into my position right now @ $23.70 The stock is taking a huge hit today no doubt. But note that the stock has been liquidated from its high of 33.52 all the way to now @ 23.7 = $10 dollars. It is getting toward that point where the dumping should start to ease up. And looking at the chart -


we can see it is really nearing oversold status (note what happened the last 3 times when the stock's RSI neared 30 and the massive rebound that ensued). There's also an uptrend (indicated by the line I drew) that shows it should be bottoming out soon. If you are still short the position, many congrats for making a KILLING off this baby. But I strongly suggest to consider start locking in gains. Note the diminishing sell volume along with the oversold technicals. Also note the similar sell pattern we are seeing from previous massive dumps.

It's not going to rebound overnight. But I'm going to hold on to this one for a while rather than day trading it. I think this will at least rebound back to near $30 in the days to come. Not saying it won't have volatility. But we've seen where it has gone before not so long ago. And last quarter, PWRD reported great earnings. Yes, it is very unfortunate that the Earthquake in China could have an impact towards Chinese stocks. But I don't think it will be their Achilles heel.

I haven't been looking into too many other names lately. That's because to make money it doesn't require that many. If you can study the trends of a few stocks and nail the entry points. It is all you'll need.

Oil was up in the morning but it is getting sold off. We will see what happens

SOLF getting a bounce today. Once again I have been day trading that stock. The volatility in SOLF is just too good to pass up. 75% of my gains from the week had been from actively trading my positions in and out. This past Sunday when I was sitting down to study SOLF I vowed to myself I will stick with the plan and execute everytime with conviction when opportunities presented themselves. I am glad I did.

Let's see what happens at the end of the day.

-DL

Disclosure
Long GOOG, 75%V, 70% PWRD
Short USO

UPDATE 1:
Markets ended at the lows of the day, concluding the first week of major losses across all indices. What can we expect next week?

S&P 500.


Even though this market will most likely continue to have a downtrend direction, as we know by now nothing ever goes in one direction in a straight line. After a week of heavy selling the S&P 500 is now about 4 points away from the 50DMA which should for the time being provide strong support for an oversold bounce. So keep that in mind. Or who knows, maybe the big money will just continue to slaughter the markets silly. But recall when the markets were going up big, there would also be pullback and slightly down days to regain momentum before the next leg up.

The same works for a downtrending market. After multi day selloffs it is very likely we will see a bounce. Don't trust it for too long. But at the same time, don't go piling in hand over fists on the short side in the beginning of next week just because the selloff that ensued this week. You could get whipsawed out, and that's never fun. Always think it through.

I am going camping this memorial day weekend. Monday there is no trading so I will talk to you all on Tuesday. Have a good weekend and enjoy yourself.

-DL

Disclosure
Long GOOG, 75%V, 70%PWRD
Short USO


Thursday, May 22, 2008

New Technical Indicator - Market Velocity and Force Meter

I am pretty excited about tomorrow because the Scottrade Elite platform just had a nice upgrade. There is now a new tool call the Velocity & Forces meter.


My preliminary impression of the tool is this will be a graphical interpretation of Level II information. It will show the buying/selling force of any stock and will also indicate the velocity of the buy and sells. It calculates the information by the second, shows the current stock momentum, and the actual volume of sales.

Looks good! If anyone is currently using a different brokerage platform and have something similar to this tool, please share your experience and your thoughts about its effectiveness. Would be nice!