What a relief we've had the past few sessions. Markets took off with a vengeance as oversold conditions setup the perfect scenario to initiate short squeezes to give buyers waiting the incentive to buy.
I am looking for the markets to continue now on a temporary upswing. The financial sector might have gone up too much too fast, but the thing is when there's doubt in the air it probably means it has more room to go up.
I bought a new position in Nucor (NUE). I've been waiting on the sidelines for a very long time and now it looks like a nice chance to get in since it is right on the 200DMA now. It even broke down a little bit but looks like all the weak hands are being flushed out. I have been wrong a lot before about picking bottoms but that's why I don't even try to. I'm just going to buy a position now and continue building on it. This is at least a $70 dollar stock imo. If there are some quick rips up due to short covering then I'll consider just trading it.
If oil continues to fall out of flavor we could see a nice sustained move up. It broke below $129 so let's see if we can get a meaningful downmove.
- DL
Long ATI, RIO, NUE, JCG, SOLF, GOOG
Saturday, July 19, 2008

Wednesday, July 16, 2008
Could Today be our Long Awaited Turnaround?
What a fantastic up move today in the markets. News that Wells Fargo beating earnings expectation sent shorts scrambling to cover. I want to point to something very interesting in the SKF, which is a 2x short financial ETF.

Talk about getting destroyed today it is down $45 dollars, or 22% on MASSIVE VOLUME. If financial companies that report this week can continue to post in line earnings showing analyst have been overly pessimistic, mark my words we will see this flush out of shorts to lock in profits and we will see this ETF driven to the floor. Because as I have posted yesterday, longs have been severely overkilled. And sentiment in the markets have gotten so negative that all it takes is something positive to happen and bam, we get a massive short squeeze.
Some of the financial stocks during today's rally were just unbelievable. We are talking 20%-30% moves in ONE DAY. Granted, they have been destroyed this past year. But buying stocks are all about entry points. If caught correctly it can be very profitable. Keep an eye on financial as they seem to have the capability to go higher if theres continual following through on short squeezes.
Ebay posting up some good numbers but the stock is selling off. I think it is just partly because the stock ran up into earnings. Tomorrow I'm looking for a pause day. Meaning either small move up or down or stay flat. What we DON'T want to see is a selloff back down to the lows of the day. Because that'll completely negate the move today. We need to see confirmation.
Oil coming down hard the past few days. We have seen this happen before, but we need confirmation too. But everything that needed to work today worked. Financials caught a mega bid, Oil came down hard, the dollar firmed. Let's see if the momentum will continue.
Hang tough longs, perhaps this time around, the calvary is coming.
- DL

Talk about getting destroyed today it is down $45 dollars, or 22% on MASSIVE VOLUME. If financial companies that report this week can continue to post in line earnings showing analyst have been overly pessimistic, mark my words we will see this flush out of shorts to lock in profits and we will see this ETF driven to the floor. Because as I have posted yesterday, longs have been severely overkilled. And sentiment in the markets have gotten so negative that all it takes is something positive to happen and bam, we get a massive short squeeze.
Some of the financial stocks during today's rally were just unbelievable. We are talking 20%-30% moves in ONE DAY. Granted, they have been destroyed this past year. But buying stocks are all about entry points. If caught correctly it can be very profitable. Keep an eye on financial as they seem to have the capability to go higher if theres continual following through on short squeezes.
Ebay posting up some good numbers but the stock is selling off. I think it is just partly because the stock ran up into earnings. Tomorrow I'm looking for a pause day. Meaning either small move up or down or stay flat. What we DON'T want to see is a selloff back down to the lows of the day. Because that'll completely negate the move today. We need to see confirmation.
Oil coming down hard the past few days. We have seen this happen before, but we need confirmation too. But everything that needed to work today worked. Financials caught a mega bid, Oil came down hard, the dollar firmed. Let's see if the momentum will continue.
Hang tough longs, perhaps this time around, the calvary is coming.
- DL
Where the F*** you been Xman?!?
Greetings my fellow online readers,
I have been away for quite some time. And my apologies for not even saying anything and just took off. The reason being was simply I needed some time away from the stock market. The market's inconsistency coupled with fire-selling on stocks that have already been beat up severely defies logic and frankly frustrated me to a point where I needed to step back and regroup. And that was exactly what I did. For a few weeks I just held my positions, checked them once daily and that was it.
But running is not the solution. So I am back now. I don't know how many of you still check the blogs but I will try to pick up the pieces where I've left off. We've had a few sizable moves up but all were greeted by hard sells. We even hit below 11k today...sad times for the stock market.
The Vix meter is nearing the 30+ mark again, put/call ratio is extremely skewed towards the put side, the sentiment is severely negative.
The government has been doing absolutely nothing productive to induce investor confidence. Add all of this to the unbelieveable drop the financial sector have experienced and we have on our hands a tumultuous period in time that will most likely go down in history books as one of the worst in the 21st century.
As for my positions...ya I have been taking beatings pretty hard. Still have JCG, V, RIO, GOOG, Sold my PWRD. And I've also initiated a position on Alleghany technologies (ATI) with a cost average of $55.
As for an outlook, lets see what the technicals of the chart tells us:

The massive downdraft we have experienced the past 2 months is simply UNBELIEVABLE. I don't dare to try to call a bottom but if I were to look care carefully it is obvious that yesterday 7/15 the selling was at its HIGHEST dating all the way back to the beginning of the year.
-Indicators are just severely oversold
- Sentiment is extremely negative
- Short levels HIGHEST since Bear Stearns
We have broken the lows and gone down significantly. So there's no denying now, this market is an official bear. However, it doesn't mean the markets can't bounce hard 5-10% in the near future just simply because of how ugly the tape has gotten. We have to acknowledge the fact that this market is going to take a long time to repair. And to fight a trend is to just ask for pain. But my inclination for now is we're so far below oversold that the market just needs a slight excuse or something positive to come out to give shorts the incentives to say "it's time to take profits".
OIL needs to come down. And I continue to believe that a significant correction will be coming. The key right now is in Oil, Financials, and our dollar. If Oil comes down, Financials get a bid, and the dollar firms up, we will see this market rally hard. If not, we will continue to see this dripping death.
Well that's all I have for now folks. It's been a long while, I have read all you guys comments and I appreciate you guys conversations and ideas. It makes me realize why I ought to keep up with this blog. Because together we can help one another to navigate through these historic and unusual periods.
God Bless, and God speed to all of us.
- David Lok (DL) aka the Xman
Disclosure:
Long V, GOOG, JCG, RIO, ATI
I have been away for quite some time. And my apologies for not even saying anything and just took off. The reason being was simply I needed some time away from the stock market. The market's inconsistency coupled with fire-selling on stocks that have already been beat up severely defies logic and frankly frustrated me to a point where I needed to step back and regroup. And that was exactly what I did. For a few weeks I just held my positions, checked them once daily and that was it.
But running is not the solution. So I am back now. I don't know how many of you still check the blogs but I will try to pick up the pieces where I've left off. We've had a few sizable moves up but all were greeted by hard sells. We even hit below 11k today...sad times for the stock market.
The Vix meter is nearing the 30+ mark again, put/call ratio is extremely skewed towards the put side, the sentiment is severely negative.
The government has been doing absolutely nothing productive to induce investor confidence. Add all of this to the unbelieveable drop the financial sector have experienced and we have on our hands a tumultuous period in time that will most likely go down in history books as one of the worst in the 21st century.
As for my positions...ya I have been taking beatings pretty hard. Still have JCG, V, RIO, GOOG, Sold my PWRD. And I've also initiated a position on Alleghany technologies (ATI) with a cost average of $55.
As for an outlook, lets see what the technicals of the chart tells us:

The massive downdraft we have experienced the past 2 months is simply UNBELIEVABLE. I don't dare to try to call a bottom but if I were to look care carefully it is obvious that yesterday 7/15 the selling was at its HIGHEST dating all the way back to the beginning of the year.
-Indicators are just severely oversold
- Sentiment is extremely negative
- Short levels HIGHEST since Bear Stearns
We have broken the lows and gone down significantly. So there's no denying now, this market is an official bear. However, it doesn't mean the markets can't bounce hard 5-10% in the near future just simply because of how ugly the tape has gotten. We have to acknowledge the fact that this market is going to take a long time to repair. And to fight a trend is to just ask for pain. But my inclination for now is we're so far below oversold that the market just needs a slight excuse or something positive to come out to give shorts the incentives to say "it's time to take profits".
OIL needs to come down. And I continue to believe that a significant correction will be coming. The key right now is in Oil, Financials, and our dollar. If Oil comes down, Financials get a bid, and the dollar firms up, we will see this market rally hard. If not, we will continue to see this dripping death.
Well that's all I have for now folks. It's been a long while, I have read all you guys comments and I appreciate you guys conversations and ideas. It makes me realize why I ought to keep up with this blog. Because together we can help one another to navigate through these historic and unusual periods.
God Bless, and God speed to all of us.
- David Lok (DL) aka the Xman
Disclosure:
Long V, GOOG, JCG, RIO, ATI
Friday, June 6, 2008
Market Update Friday 6/7/08 - Freefall
Market indices are getting annihilated today on a big reversal from yesterday's fortune. Jobs report is the supposed culprit - 5.5% unemployment...thanks Bush.
Not much to say today besides yes, sucks to be in this position and sucks that every single equity position I have is working against me today. I have to be honest I did not expect the markets to whipsaw like this and I did not set myself up correctly for it. Usually I have a sixth sense about the moves to come. But today, just like yesterday, completely blindsided me. Nevertheless, during times of fire selling and negativity in news headline, we just have to remain discipline and trust what the charts show us. That way, we don't panic sell ourselves and do something stupid.
PWRD taking a big hit today, it is near the double bottom it formed a couple weeks back. The RSI/Stochasics are still well below average and are still very oversold. Therefore, I am buying the remaining 25% position now @ 24.00 . This is going to be a longer term hold for me until I see it showing signs of overbought on the charts. I am convicted.
Same with JCG. Not very nice to see all my nice gains from yesterday evaporate again. But I am going to stay disciplined and let this ride out. I believe the downside is way overdone on these stocks. And yes, even though today it may not feel like it, I am still going to hold on to the shares. This has been pretty much a bottom fished play. So I am confident 1 month down the line the price will be significantly higher than where it is now.
USO...this chart has been unbelievable. Although I believe the ultimate direction of oil will be down the next month or so, it's not very nice to see my short go from being positive to down 10% in 2 sessions. It hit my cover today as it reached $110. Half my position has been sold as a result. Well, I stuck with it through thick and thin. But there still comes a time when I have to keep my losses in check. I didn't have a very large position in it so hey, live and learn. I still think the chart is extremely overextended on USO, but I can't fade the strength it exudes. Good luck to people chasing this long, and congrats if you had the courage to buy it during its monster dips.
I'm not paying attention to the indices today. Rather, I'm spending my time to review and study charts. I already know today is going to be ugly, so need to turn a bad situation into a good one. I'm interested in hearing you guys opinion on how you feel about the markets. And how you are positioning yourselves for the days to come.
Live to fight another day
- DL
Disclosure
Long GOOG, 75%V, 100%PWRD, 166% JCG
Short 50% USO
Update 1

- Recognize this chart pattern? Green line is where I project the stock will be headed in the near future. This could be the W pattern forming with all the indicators at extremely oversold status. Note the light volume selloff, double bottom holding in, and where the stock has sold off from to here.
Hurts now, but trust that discipline and technicals will lead us back to the green. Don't act on impulse and emotions. Stay true to facts and numbers.
- DL
Not much to say today besides yes, sucks to be in this position and sucks that every single equity position I have is working against me today. I have to be honest I did not expect the markets to whipsaw like this and I did not set myself up correctly for it. Usually I have a sixth sense about the moves to come. But today, just like yesterday, completely blindsided me. Nevertheless, during times of fire selling and negativity in news headline, we just have to remain discipline and trust what the charts show us. That way, we don't panic sell ourselves and do something stupid.
PWRD taking a big hit today, it is near the double bottom it formed a couple weeks back. The RSI/Stochasics are still well below average and are still very oversold. Therefore, I am buying the remaining 25% position now @ 24.00 . This is going to be a longer term hold for me until I see it showing signs of overbought on the charts. I am convicted.
Same with JCG. Not very nice to see all my nice gains from yesterday evaporate again. But I am going to stay disciplined and let this ride out. I believe the downside is way overdone on these stocks. And yes, even though today it may not feel like it, I am still going to hold on to the shares. This has been pretty much a bottom fished play. So I am confident 1 month down the line the price will be significantly higher than where it is now.
USO...this chart has been unbelievable. Although I believe the ultimate direction of oil will be down the next month or so, it's not very nice to see my short go from being positive to down 10% in 2 sessions. It hit my cover today as it reached $110. Half my position has been sold as a result. Well, I stuck with it through thick and thin. But there still comes a time when I have to keep my losses in check. I didn't have a very large position in it so hey, live and learn. I still think the chart is extremely overextended on USO, but I can't fade the strength it exudes. Good luck to people chasing this long, and congrats if you had the courage to buy it during its monster dips.
I'm not paying attention to the indices today. Rather, I'm spending my time to review and study charts. I already know today is going to be ugly, so need to turn a bad situation into a good one. I'm interested in hearing you guys opinion on how you feel about the markets. And how you are positioning yourselves for the days to come.
Live to fight another day
- DL
Disclosure
Long GOOG, 75%V, 100%PWRD, 166% JCG
Short 50% USO
Update 1

- Recognize this chart pattern? Green line is where I project the stock will be headed in the near future. This could be the W pattern forming with all the indicators at extremely oversold status. Note the light volume selloff, double bottom holding in, and where the stock has sold off from to here.
Hurts now, but trust that discipline and technicals will lead us back to the green. Don't act on impulse and emotions. Stay true to facts and numbers.
- DL
Thursday, June 5, 2008
Market Update - Thursday 6/5
On the run today so I won't get to post until probably this evening. But just updating some of you with my plays.
I am out of UAUA at 10.35 on a sell trigger. Boom baby, now that's some fast money. 15% in two days doesn't get any better than that.
Sitting tight on the rest of my positions though. Great day in the markets. Hope you guys get to take full advantage of it.
Talk to yall soon
- DL
Disclosure
Long GOOG, 75%v, 75%PWRD, 166% JCG
Short USO
I am out of UAUA at 10.35 on a sell trigger. Boom baby, now that's some fast money. 15% in two days doesn't get any better than that.
Sitting tight on the rest of my positions though. Great day in the markets. Hope you guys get to take full advantage of it.
Talk to yall soon
- DL
Disclosure
Long GOOG, 75%v, 75%PWRD, 166% JCG
Short USO
Wednesday, June 4, 2008
Market Update 6/4/2008
Well today the big headline is Lehman has buyers for its debt...anytime when a banking firm has to come out and say it is making progress to eliminate its debt probably means theres a lot more hiding in its closet. Nevertheless, the stock climbed from the abyss from the morning plunge at 27 and is now in the green. For those of you speculating around Lehman and playing the moves, stay quick and nimble.
Also in the spotlight are MBI and ABK - aka the bond insurers, that they are getting downgraded by Moodys. Because of this their stocks are getting annihilated...again...
I have lost all my respect for the rating agencies already. How many times have they downgraded and upgraded their stocks? Same with the S&P. These guys are clowns. And for MBI and ABK to tank "because of the downgrade." Why is the media is acting so suprised!? As if it's the first time we've seen this happening? Ha
JCG after its morning plunge once again is hovering near flatline. The price action is starting to look encouraging because a necktie support is now forming underneath at the $35.50 level. Should JCG close in the green today technicians will be all over this IMO and it will be an indicator for shorts to cover positions. That's when we could finally see that POP. Hang tough!
I am buying a new trading position into strength because the stock has simply been annihilated but is now showing signs of life. United Airlines (UAUA). Yes, highly speculative. But I am buying it for a few reasons: 1) It has been obliterated as we all know YTD. 2) OIL IS COMING DOWN. And the more oil pulls back, the bigger pressure it would be for shorts of airlines to cover. Causing massive short squeezes. And while I'm at it, how bout that USO Short?! My discipline is now paying off, I am in the money.
UAUA has already gone from 7.77 to where it is now at 9.36 in TWO DAYS. That's a big move! But I don't think its done yet it still has room for the upside. I bought @ $9.00 even on a breakout trade. Stop loss at exactly $9. My target to close position is @ 10.35-$10.50. $1.35 move on small stock like this is a pretty sizeable gain. I am going on record right now though and saying when this stock hits anywhere above $10.50 or if oil shows any signs of a firm rebound I WILL BE OUT COMPLETELY. So make no mistake I'm not going to be in it for long.
Good luck to us today
- DL
Disclosure
Long GOOG, 75%V, 35%PWRD, 166%JCG, UAUA
Short USO
UPDATE 1:
Buying my PWRD position back now @ $25.58. From the chart setup it looks like the downside is limited. Add that to the fact the major indices have already had a sizeable correction (near 700 points plunge from the highs at 13,000 and close to 300 points in the past 5 sessions), it is once again due for a short term bounce. Along with it PWRD should be heading back up toward the $27+ zone in the very near future.
Disclosure
Long 75% PWRD
Update 2:
USO effectively broke through its 20DMA today and failed to go back up. It will probably free fall now until $95 where it will find its next level of support.
Also in the spotlight are MBI and ABK - aka the bond insurers, that they are getting downgraded by Moodys. Because of this their stocks are getting annihilated...again...
I have lost all my respect for the rating agencies already. How many times have they downgraded and upgraded their stocks? Same with the S&P. These guys are clowns. And for MBI and ABK to tank "because of the downgrade." Why is the media is acting so suprised!? As if it's the first time we've seen this happening? Ha
JCG after its morning plunge once again is hovering near flatline. The price action is starting to look encouraging because a necktie support is now forming underneath at the $35.50 level. Should JCG close in the green today technicians will be all over this IMO and it will be an indicator for shorts to cover positions. That's when we could finally see that POP. Hang tough!
I am buying a new trading position into strength because the stock has simply been annihilated but is now showing signs of life. United Airlines (UAUA). Yes, highly speculative. But I am buying it for a few reasons: 1) It has been obliterated as we all know YTD. 2) OIL IS COMING DOWN. And the more oil pulls back, the bigger pressure it would be for shorts of airlines to cover. Causing massive short squeezes. And while I'm at it, how bout that USO Short?! My discipline is now paying off, I am in the money.
UAUA has already gone from 7.77 to where it is now at 9.36 in TWO DAYS. That's a big move! But I don't think its done yet it still has room for the upside. I bought @ $9.00 even on a breakout trade. Stop loss at exactly $9. My target to close position is @ 10.35-$10.50. $1.35 move on small stock like this is a pretty sizeable gain. I am going on record right now though and saying when this stock hits anywhere above $10.50 or if oil shows any signs of a firm rebound I WILL BE OUT COMPLETELY. So make no mistake I'm not going to be in it for long.
Good luck to us today
- DL
Disclosure
Long GOOG, 75%V, 35%PWRD, 166%JCG, UAUA
Short USO
UPDATE 1:
Buying my PWRD position back now @ $25.58. From the chart setup it looks like the downside is limited. Add that to the fact the major indices have already had a sizeable correction (near 700 points plunge from the highs at 13,000 and close to 300 points in the past 5 sessions), it is once again due for a short term bounce. Along with it PWRD should be heading back up toward the $27+ zone in the very near future.
Disclosure
Long 75% PWRD
Update 2:
USO effectively broke through its 20DMA today and failed to go back up. It will probably free fall now until $95 where it will find its next level of support.
Tuesday, June 3, 2008
Market Update 6/2/2008
Markets are selling off bigtime across all major indices. Major news hitting the headline today is Fed Chairman Bernanke coming out and for the first time in public announcing his concerns about inflation. He pretty much signaled the fed is done cutting rates. Now are we going to be seeing hikes anytime soon? My hunch is probably not because the economy is still very fragile. But the fact that Bernanke is coming out to say he is concerned about inflation anchored the dollar and will probably stop it from deteriorating any further.
Also another big headline that grabbed my attention today is investing legend George Soros coming out and warning the possibility of a "1987 market crash" due to the potential commodity bubble exploding. He explains in the article here
Long story short, he is saying since the trade has been piled on so excessively by hedge funds they have the power to unwind it and cause a seismic shift in the market's stability. I actually can't disagree with him here because the commodity trade has been over-extended. I can't say when this will happen and for now I will still not short these names. But I would not chase them at this point either. This is why however I still have my USO short. I truly believe oil will have a massive correction that will cause create gaping holes in many people's portfolios should they continue to chase it long.
JCG is taking ANOTHER big hit today. I am going to buy it again right now @ $35.30 and like how I have said before I am going to keep buying it until it goes up. Look at this chart:

Yes, I got in a little too early and I own it. I have been on the wrong side of the deal. This started off as a quick scalp trade for me but looks like it's going to be turning into an investment. But looking at this chart tells it all. This stock is SEVERELY OVERKILLED. It has gone from its high of $50.35 roughly 2 weeks ago to $35 - Almost 30% plunge in a straight line. When RSI is below 30 for ANY stock, and for stochastics to fall below the 20 line, it is severely overkilled. A lot of longs who have lost a ton of money are ejecting from the company to stop losses. I may have picked up their shares a little too early but still, I am staying disciplined to this trade. Would I have wanted it to turn out better? You better believe it. But if you're in this trade too, know that I'm right there also having to sack the pain. For anyone wanting to short at these levels...God speed because on the slightest uptick this stock will have a massive short squeeze and will annihilate bears. (28% short interest according to Shortsqueeze )
I am not backing away from this. This will be a true test of discipline and technical analysis. It has paid off handsomely for me in the past time after time. And I believe it will once again lead me back into the money in the very near future.
Let's see what happens at the end of the day.
- DL
Disclosure
Long GOOG, 75%V, 35% PWRD, 166% JCG
Short USO
Also another big headline that grabbed my attention today is investing legend George Soros coming out and warning the possibility of a "1987 market crash" due to the potential commodity bubble exploding. He explains in the article here
Long story short, he is saying since the trade has been piled on so excessively by hedge funds they have the power to unwind it and cause a seismic shift in the market's stability. I actually can't disagree with him here because the commodity trade has been over-extended. I can't say when this will happen and for now I will still not short these names. But I would not chase them at this point either. This is why however I still have my USO short. I truly believe oil will have a massive correction that will cause create gaping holes in many people's portfolios should they continue to chase it long.
JCG is taking ANOTHER big hit today. I am going to buy it again right now @ $35.30 and like how I have said before I am going to keep buying it until it goes up. Look at this chart:

Yes, I got in a little too early and I own it. I have been on the wrong side of the deal. This started off as a quick scalp trade for me but looks like it's going to be turning into an investment. But looking at this chart tells it all. This stock is SEVERELY OVERKILLED. It has gone from its high of $50.35 roughly 2 weeks ago to $35 - Almost 30% plunge in a straight line. When RSI is below 30 for ANY stock, and for stochastics to fall below the 20 line, it is severely overkilled. A lot of longs who have lost a ton of money are ejecting from the company to stop losses. I may have picked up their shares a little too early but still, I am staying disciplined to this trade. Would I have wanted it to turn out better? You better believe it. But if you're in this trade too, know that I'm right there also having to sack the pain. For anyone wanting to short at these levels...God speed because on the slightest uptick this stock will have a massive short squeeze and will annihilate bears. (28% short interest according to Shortsqueeze )
I am not backing away from this. This will be a true test of discipline and technical analysis. It has paid off handsomely for me in the past time after time. And I believe it will once again lead me back into the money in the very near future.
Let's see what happens at the end of the day.
- DL
Disclosure
Long GOOG, 75%V, 35% PWRD, 166% JCG
Short USO
Monday, June 2, 2008
New week starts off with a plunge
Last Thursday I mentioned to start taking long positions off if you're swing trading because the market technicals told us so. And sure enough, today we are seeing the continuation to the market fall.
JCG is taking another hit today. I am buying another 33% position at $36. I will keep buying it until this rebounds. From a technicals perspective JCG has just been overkilled way too much, way too fast. Even if the retail "outlook" may be looking bad in the year to come, I pay much more attention to technicals over fundamentals and outlooks. And right now, the technicals are pointing to this stock as a screaming buy. There's a time to be cautious and there's a time to be greedy. JCG in my opinion is now a stock I'm willing to buy hand over fist. I'll be the first one to double and triple slap myself to oblivion if JCG doesn't see $40 within a month. Be patient with this trade, this is now the time when everyone is jumping off the cliff. And discipline tells us to buy stocks when they are getting obliterated. This is still a profitable company, it has no debt, and just because it lowered guidance doesn't mean the stock will never see another green day in its life. BUY ON FEAR.
PWRD position taking a beating again today. Good thing I lightened up last Friday. I hope you did too. If PWRD takes another hit tomorrow I am going to buy my position back.
The key now to trading in a market downdraft if you're long stocks is to pick your spots and stay disciplined. Don't let the gyrations shake you out of stocks you own if the technicals are present to support the price action.
Markets are about to close in 15 minutes but rebounding a good amount from its lowest levels of the day (I think from nearly 200 points plunge?) Invest wisely and stay sharp.
- DL
Disclosure
Long GOOG, 75% V, 35% PWRD, 133% JCG
Short USO
UPDATE 1:
NOTICE JCG rebounded off from its lowest point at $35.85 and CLOSED ABOVE THE JANUARY BOTTOM of $36.40. The floor is still in tact.
JCG closed Monday @$36.47
Watch this trade very carefully, it could turn profitable in the very near future.
JCG is taking another hit today. I am buying another 33% position at $36. I will keep buying it until this rebounds. From a technicals perspective JCG has just been overkilled way too much, way too fast. Even if the retail "outlook" may be looking bad in the year to come, I pay much more attention to technicals over fundamentals and outlooks. And right now, the technicals are pointing to this stock as a screaming buy. There's a time to be cautious and there's a time to be greedy. JCG in my opinion is now a stock I'm willing to buy hand over fist. I'll be the first one to double and triple slap myself to oblivion if JCG doesn't see $40 within a month. Be patient with this trade, this is now the time when everyone is jumping off the cliff. And discipline tells us to buy stocks when they are getting obliterated. This is still a profitable company, it has no debt, and just because it lowered guidance doesn't mean the stock will never see another green day in its life. BUY ON FEAR.
PWRD position taking a beating again today. Good thing I lightened up last Friday. I hope you did too. If PWRD takes another hit tomorrow I am going to buy my position back.
The key now to trading in a market downdraft if you're long stocks is to pick your spots and stay disciplined. Don't let the gyrations shake you out of stocks you own if the technicals are present to support the price action.
Markets are about to close in 15 minutes but rebounding a good amount from its lowest levels of the day (I think from nearly 200 points plunge?) Invest wisely and stay sharp.
- DL
Disclosure
Long GOOG, 75% V, 35% PWRD, 133% JCG
Short USO
UPDATE 1:
NOTICE JCG rebounded off from its lowest point at $35.85 and CLOSED ABOVE THE JANUARY BOTTOM of $36.40. The floor is still in tact.
JCG closed Monday @$36.47
Watch this trade very carefully, it could turn profitable in the very near future.
Friday, May 30, 2008
JCREW Fire Sale = Our Opportunity
JCREW (JCG) Getting ANNIHILATED today. It hasn't seen this type of fire sale the last 12 months! Hell take that back, it hasn't seen this type of fire sale since its IPO! Look at the volume bar! That's what I call M U R D E R E D. But this is so overkilled that I believe we can buy it for a quick scalp.

- Note the double bottom that is holding since the January Lows
I am buying it for a trade right now at $37.35 going to ride the reflex bounce potentially back up to $40~
Let's see if it'll work out.
I am selling half my PWRD position @ $27. Made nearly 4 points on it. No one ever made a dime being greedy. So it's time to sell.
Markets are setting up now perfectly for the next leg down. If you are long stocks, pick your spots and stay disciplined!
- DL
Disclosure
Long GOOG, 75% V, 35% PWRD, JCG
Short USO

- Note the double bottom that is holding since the January Lows
I am buying it for a trade right now at $37.35 going to ride the reflex bounce potentially back up to $40~
Let's see if it'll work out.
I am selling half my PWRD position @ $27. Made nearly 4 points on it. No one ever made a dime being greedy. So it's time to sell.
Markets are setting up now perfectly for the next leg down. If you are long stocks, pick your spots and stay disciplined!
- DL
Disclosure
Long GOOG, 75% V, 35% PWRD, JCG
Short USO
Thursday, May 29, 2008
Sell into this Rally
Charts show markets have retraced back up since the plunge but now right below the 50DMA. The bounce should be coming to an end soon. If you have been trading the long side, in my opinion consider to start selling.
I have not been trading too much the past few days. There are some personal matters that I have to attend to so I'm not able to trade or update the blog too much. Good luck everyone.
-DL
I have not been trading too much the past few days. There are some personal matters that I have to attend to so I'm not able to trade or update the blog too much. Good luck everyone.
-DL
Wednesday, May 28, 2008
Watch the PWRD pullback
I am on the run again today so I will do my post later this afternoon. But if you have been trading PWRD with me, congrats to us we are up nicely now. Watch PWRD potentially pull back though if it doesn't clear the 50/200DMA from a 3 month perspective. However, if it does pull back, this is the point in my opinion to add position:

Watch the $25.27 "Necktie" intraday support. when two MA's converge together like that it is usually very strong and not likely to break.
Good luck today. Invest wisely and be careful out there.
-DL
Disclosure
Long GOOG, 75%V, 70% PWRD
Short USO

Watch the $25.27 "Necktie" intraday support. when two MA's converge together like that it is usually very strong and not likely to break.
Good luck today. Invest wisely and be careful out there.
-DL
Disclosure
Long GOOG, 75%V, 70% PWRD
Short USO
Tuesday, May 27, 2008
How I Daytrade
So I have a few readers interested in knowing how I daytrade SOLF and how to look for entry/exit points. It is tough to explain with text and honestly if I had a way to post videos instead it would be much easier to understand. But here it is to the best of my knowledge.
Day trading is about understanding price, pattern, time, and volume at a specific moment and then utilizing indicators to predict the potential future movement of the stock. When I day trade, I first study where the stock has been. To do this, I pull up a 3 month daily chart - That is the daily movement of the stock price for the past 3 months.
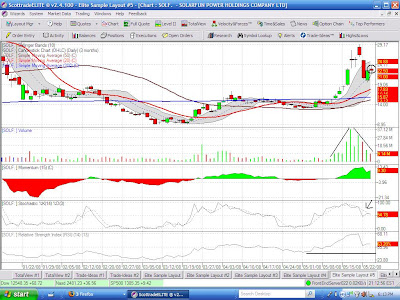
From a 3 month chart, the amount of volume in the past couple weeks is unmistakably higher. More volume = more volatility.
throughout the past week SOLF has made a gigantic move up since its breakout from the 200DMA (remember my post about that from a couple weeks back?), topped out near 29, and have sold off. It has then subsequently touched the middle bollinger line (the dotted line within the shade), and bounced. Since the price level of the stock is now currently below the upper bollinger line, I will reasonably expect the stock to once again hit resistance as it reaches there ($24.88).
The stochastics tell me the stock has a big potentially to continue down because the solid line is trapped below the dotted line.. When the solid cannot breakout from the dotted, it is a bearish indicator.
Now lets look at the 2 day 10 minute chart.

Reading a 10 minute chart is almost identical to reading wider time scale charts with a few exceptions - more emphasis needs to be placed on technical indicators as well as the price pattern that is forming. The indicator I pay attention to the most is the stochastics. During the intraday if the stochastics reaches 90-100 percentile, that is my target to put on short positions. Notice as the stochastic started coming down the stock tanked with it.
The price pattern is even more important. Notice where I boxed the bottom and top of the stock intraday. During the bottom, we see the stock touching the 50DMA and bounced. The reason I know it bounced is because of the "bottoming tail" that emerged. This means, during the 10 minutes when those bars were active, the stock got sold off to that level and when it touched the moving average buyers came in and boosted the stock price back up. When you see multiple bottoming tails (stock has to close in the top 25% tier of the candle), along with the stochastics at the 10-20 percentile, THAT IS THE SIGNAL TO COVER SHORT POSITIONS AND GO LONG.
Notice also during the very extreme of the selloff, the momentum indicator also shows a severe bias towards the red side, when that occurs, it is also the signal to cover.
The same with topping action. Notice the top box I drew in. When the stock is starting to top off, you will see the stochastics reaching 90%+, you will see the momentum indicator skewed towards the green, and the most important would be the "topping tails". Just like a bottoming tail, a topping tail occurs when the stock gets a bid at certain prices but cannot sustain. During the 10 minutes when those bars were active, the stock pushed up toward higher highs', and as they got up, sellers came in and locked profits. When there are multiple topping tails emerging (stock has to close in the bottom 25% tier of the candle), along with the stochastics at the 90-100 percentile, THAT IS THE SIGNAL TO SELL LONGS AND INITIATE SHORTS.
Understanding how the chart patterns work is already half the battle. Add all the other technical indicators into the equation allows me to predict with about 75-80% certainty of what the stock will do next. It is not an exact science though and sometimes it is very tough to gauge it during a live session. It is one thing to study the charts now "After the fact" versus trading it live. Even with all these indicators, I still mess up from time to time. Today because I didn't stay disciplined my intraday gains were wiped. But this is my method to day trade.
Finally, the Level II stream as well as the velocity meter provide great tells to the stock momentum and is vital to day trading. It gives day traders very good ideas the amount of bids being queued on the long and short side, as well as telling me the intensity of the buy and sells.
Day trading is about putting all the pieces to the puzzle together and being nimble. In addition, the amount of shares you can trade is very important as well. Because the more shares you are able to move around, the less time exposure it is required for the trade. And less time exposure = less risk. Factors such as capital gain taxes and transaction fees also needs to be considered because those are expenses that cannot be avoided. Trading 100 shares of SOLF at 30 cents gain will only equate in 30 dollars of profit. In the scheme of percentage movement, that is a sizeable gain. But 30 dollars of profit subtract on average 15 dollars in transaction fee would mean already half the profit is wiped. Then consider the 30%~ of taxes that has to be paid, it wouldn't leave too much profit left and thus not worthwhile for the effort put in. Not to mention in order for a 20 dollar stock to move 1 dollar will require massive amount of volume. And the longer a daytrade is in place, the more risk it gets exposed to.
But 1000 shares on 30 cents profit would equate to 300 dollars. 300 dollars subtract 15 dollar transaction fees = 285 dollars then deduct roughly 30% in capital gain taxes would still leave a net profit of $200. Now that is more like it. Make sure to consider whether day trading is suitable for you in terms of risk as well as the rewards. Make sure it is worth the effort!
Good luck!
Day trading is about understanding price, pattern, time, and volume at a specific moment and then utilizing indicators to predict the potential future movement of the stock. When I day trade, I first study where the stock has been. To do this, I pull up a 3 month daily chart - That is the daily movement of the stock price for the past 3 months.

From a 3 month chart, the amount of volume in the past couple weeks is unmistakably higher. More volume = more volatility.
throughout the past week SOLF has made a gigantic move up since its breakout from the 200DMA (remember my post about that from a couple weeks back?), topped out near 29, and have sold off. It has then subsequently touched the middle bollinger line (the dotted line within the shade), and bounced. Since the price level of the stock is now currently below the upper bollinger line, I will reasonably expect the stock to once again hit resistance as it reaches there ($24.88).
The stochastics tell me the stock has a big potentially to continue down because the solid line is trapped below the dotted line.. When the solid cannot breakout from the dotted, it is a bearish indicator.
Now lets look at the 2 day 10 minute chart.

Reading a 10 minute chart is almost identical to reading wider time scale charts with a few exceptions - more emphasis needs to be placed on technical indicators as well as the price pattern that is forming. The indicator I pay attention to the most is the stochastics. During the intraday if the stochastics reaches 90-100 percentile, that is my target to put on short positions. Notice as the stochastic started coming down the stock tanked with it.
The price pattern is even more important. Notice where I boxed the bottom and top of the stock intraday. During the bottom, we see the stock touching the 50DMA and bounced. The reason I know it bounced is because of the "bottoming tail" that emerged. This means, during the 10 minutes when those bars were active, the stock got sold off to that level and when it touched the moving average buyers came in and boosted the stock price back up. When you see multiple bottoming tails (stock has to close in the top 25% tier of the candle), along with the stochastics at the 10-20 percentile, THAT IS THE SIGNAL TO COVER SHORT POSITIONS AND GO LONG.
Notice also during the very extreme of the selloff, the momentum indicator also shows a severe bias towards the red side, when that occurs, it is also the signal to cover.
The same with topping action. Notice the top box I drew in. When the stock is starting to top off, you will see the stochastics reaching 90%+, you will see the momentum indicator skewed towards the green, and the most important would be the "topping tails". Just like a bottoming tail, a topping tail occurs when the stock gets a bid at certain prices but cannot sustain. During the 10 minutes when those bars were active, the stock pushed up toward higher highs', and as they got up, sellers came in and locked profits. When there are multiple topping tails emerging (stock has to close in the bottom 25% tier of the candle), along with the stochastics at the 90-100 percentile, THAT IS THE SIGNAL TO SELL LONGS AND INITIATE SHORTS.
Understanding how the chart patterns work is already half the battle. Add all the other technical indicators into the equation allows me to predict with about 75-80% certainty of what the stock will do next. It is not an exact science though and sometimes it is very tough to gauge it during a live session. It is one thing to study the charts now "After the fact" versus trading it live. Even with all these indicators, I still mess up from time to time. Today because I didn't stay disciplined my intraday gains were wiped. But this is my method to day trade.
Finally, the Level II stream as well as the velocity meter provide great tells to the stock momentum and is vital to day trading. It gives day traders very good ideas the amount of bids being queued on the long and short side, as well as telling me the intensity of the buy and sells.
Day trading is about putting all the pieces to the puzzle together and being nimble. In addition, the amount of shares you can trade is very important as well. Because the more shares you are able to move around, the less time exposure it is required for the trade. And less time exposure = less risk. Factors such as capital gain taxes and transaction fees also needs to be considered because those are expenses that cannot be avoided. Trading 100 shares of SOLF at 30 cents gain will only equate in 30 dollars of profit. In the scheme of percentage movement, that is a sizeable gain. But 30 dollars of profit subtract on average 15 dollars in transaction fee would mean already half the profit is wiped. Then consider the 30%~ of taxes that has to be paid, it wouldn't leave too much profit left and thus not worthwhile for the effort put in. Not to mention in order for a 20 dollar stock to move 1 dollar will require massive amount of volume. And the longer a daytrade is in place, the more risk it gets exposed to.
But 1000 shares on 30 cents profit would equate to 300 dollars. 300 dollars subtract 15 dollar transaction fees = 285 dollars then deduct roughly 30% in capital gain taxes would still leave a net profit of $200. Now that is more like it. Make sure to consider whether day trading is suitable for you in terms of risk as well as the rewards. Make sure it is worth the effort!
Good luck!
New Week
Had a great weekend, I hope everyone did too. I went camping for the entire weekend so I didn't get a chance to do homework on new stocks. Have some catch up work to do.
Markets are trading flat right now after the morning's rally fizzled. I think we can reasonably expect the indices to have a day or two of pauses. Last week it went down too fast without any sort of bounces.
PWRD is a winner now once again. Congrats if you bought in on the call (or if you had a fill order @ 24 because that was exactly where it opened).
If you still have it, theres a choice to be made right now (since it is up 5%).
If you believe the markets will eventually take a hit again, and therefore pulling PWRD potentially even lower, then hey, a 5% gain in one session isn't that bad. Or, you can wait for PWRD to rebound to its 200DMA and 50DMA @ $26. Which at that point would be heavy resistance and thus result in another round of selloff.
If you believe even throughout the market turmoil PWRD will eventually retrace back to 30+, then just hold on to it. And maybe set a stop at $22.
I am going to hold on to it for now. I will see what happens when the stock hits $26. PWRD historically breaks resistance very easily. Meaning support usually isn't support, and resistance isn't so either...let's see what happens.
SOLF in my humble opinion is currently one of the best day trading stocks around. The swings are so great yet the market cap of the company is small enough that if you trade anything above 1000 shares you can actually see your buy and sells moving the stock!! It's pretty fascinating. I have been day trading SOLF for a week now and have made a killing doing so. I am going to continue to do it until the trade is broken and the volatility dies out.
Someone also asked me about what I'm going to do with my USO short. My stop loss on it is at $110. If it goes anywhere below triple digits (below 100) then I'll probably cover. I still believe that oil needs to have a very big pullback. But I've had the trade for nearly two weeks now. I feel my money could be put to better use elsewhere.
Let's see what happens later today.
-DL
Disclosure
Long GOOG, 75% V, 70% PWRD
Short USO
Actively Day Trading SOLF
Markets are trading flat right now after the morning's rally fizzled. I think we can reasonably expect the indices to have a day or two of pauses. Last week it went down too fast without any sort of bounces.
PWRD is a winner now once again. Congrats if you bought in on the call (or if you had a fill order @ 24 because that was exactly where it opened).
If you still have it, theres a choice to be made right now (since it is up 5%).
If you believe the markets will eventually take a hit again, and therefore pulling PWRD potentially even lower, then hey, a 5% gain in one session isn't that bad. Or, you can wait for PWRD to rebound to its 200DMA and 50DMA @ $26. Which at that point would be heavy resistance and thus result in another round of selloff.
If you believe even throughout the market turmoil PWRD will eventually retrace back to 30+, then just hold on to it. And maybe set a stop at $22.
I am going to hold on to it for now. I will see what happens when the stock hits $26. PWRD historically breaks resistance very easily. Meaning support usually isn't support, and resistance isn't so either...let's see what happens.
SOLF in my humble opinion is currently one of the best day trading stocks around. The swings are so great yet the market cap of the company is small enough that if you trade anything above 1000 shares you can actually see your buy and sells moving the stock!! It's pretty fascinating. I have been day trading SOLF for a week now and have made a killing doing so. I am going to continue to do it until the trade is broken and the volatility dies out.
Someone also asked me about what I'm going to do with my USO short. My stop loss on it is at $110. If it goes anywhere below triple digits (below 100) then I'll probably cover. I still believe that oil needs to have a very big pullback. But I've had the trade for nearly two weeks now. I feel my money could be put to better use elsewhere.
Let's see what happens later today.
-DL
Disclosure
Long GOOG, 75% V, 70% PWRD
Short USO
Actively Day Trading SOLF
Friday, May 23, 2008
No Mercy Into Memorial Day
Well I thought the markets would be more merciful and just stay flat going into Memorial day. Looks like that was wishful thinking.
As of 10AM the markets are down over 1.2%~ across the board. It seems like wall street wants to reduce exposure going into the weekend.
My PWRD position getting dumped hand over fist. Stock is down another 5%. I am adding another 20% into my position right now @ $23.70 The stock is taking a huge hit today no doubt. But note that the stock has been liquidated from its high of 33.52 all the way to now @ 23.7 = $10 dollars. It is getting toward that point where the dumping should start to ease up. And looking at the chart -

we can see it is really nearing oversold status (note what happened the last 3 times when the stock's RSI neared 30 and the massive rebound that ensued). There's also an uptrend (indicated by the line I drew) that shows it should be bottoming out soon. If you are still short the position, many congrats for making a KILLING off this baby. But I strongly suggest to consider start locking in gains. Note the diminishing sell volume along with the oversold technicals. Also note the similar sell pattern we are seeing from previous massive dumps.
It's not going to rebound overnight. But I'm going to hold on to this one for a while rather than day trading it. I think this will at least rebound back to near $30 in the days to come. Not saying it won't have volatility. But we've seen where it has gone before not so long ago. And last quarter, PWRD reported great earnings. Yes, it is very unfortunate that the Earthquake in China could have an impact towards Chinese stocks. But I don't think it will be their Achilles heel.
I haven't been looking into too many other names lately. That's because to make money it doesn't require that many. If you can study the trends of a few stocks and nail the entry points. It is all you'll need.
Oil was up in the morning but it is getting sold off. We will see what happens
SOLF getting a bounce today. Once again I have been day trading that stock. The volatility in SOLF is just too good to pass up. 75% of my gains from the week had been from actively trading my positions in and out. This past Sunday when I was sitting down to study SOLF I vowed to myself I will stick with the plan and execute everytime with conviction when opportunities presented themselves. I am glad I did.
Let's see what happens at the end of the day.
-DL
Disclosure
Long GOOG, 75%V, 70% PWRD
Short USO
UPDATE 1:
Markets ended at the lows of the day, concluding the first week of major losses across all indices. What can we expect next week?
S&P 500.

Even though this market will most likely continue to have a downtrend direction, as we know by now nothing ever goes in one direction in a straight line. After a week of heavy selling the S&P 500 is now about 4 points away from the 50DMA which should for the time being provide strong support for an oversold bounce. So keep that in mind. Or who knows, maybe the big money will just continue to slaughter the markets silly. But recall when the markets were going up big, there would also be pullback and slightly down days to regain momentum before the next leg up.
The same works for a downtrending market. After multi day selloffs it is very likely we will see a bounce. Don't trust it for too long. But at the same time, don't go piling in hand over fists on the short side in the beginning of next week just because the selloff that ensued this week. You could get whipsawed out, and that's never fun. Always think it through.
I am going camping this memorial day weekend. Monday there is no trading so I will talk to you all on Tuesday. Have a good weekend and enjoy yourself.
-DL
Disclosure
Long GOOG, 75%V, 70%PWRD
Short USO
As of 10AM the markets are down over 1.2%~ across the board. It seems like wall street wants to reduce exposure going into the weekend.
My PWRD position getting dumped hand over fist. Stock is down another 5%. I am adding another 20% into my position right now @ $23.70 The stock is taking a huge hit today no doubt. But note that the stock has been liquidated from its high of 33.52 all the way to now @ 23.7 = $10 dollars. It is getting toward that point where the dumping should start to ease up. And looking at the chart -

we can see it is really nearing oversold status (note what happened the last 3 times when the stock's RSI neared 30 and the massive rebound that ensued). There's also an uptrend (indicated by the line I drew) that shows it should be bottoming out soon. If you are still short the position, many congrats for making a KILLING off this baby. But I strongly suggest to consider start locking in gains. Note the diminishing sell volume along with the oversold technicals. Also note the similar sell pattern we are seeing from previous massive dumps.
It's not going to rebound overnight. But I'm going to hold on to this one for a while rather than day trading it. I think this will at least rebound back to near $30 in the days to come. Not saying it won't have volatility. But we've seen where it has gone before not so long ago. And last quarter, PWRD reported great earnings. Yes, it is very unfortunate that the Earthquake in China could have an impact towards Chinese stocks. But I don't think it will be their Achilles heel.
I haven't been looking into too many other names lately. That's because to make money it doesn't require that many. If you can study the trends of a few stocks and nail the entry points. It is all you'll need.
Oil was up in the morning but it is getting sold off. We will see what happens
SOLF getting a bounce today. Once again I have been day trading that stock. The volatility in SOLF is just too good to pass up. 75% of my gains from the week had been from actively trading my positions in and out. This past Sunday when I was sitting down to study SOLF I vowed to myself I will stick with the plan and execute everytime with conviction when opportunities presented themselves. I am glad I did.
Let's see what happens at the end of the day.
-DL
Disclosure
Long GOOG, 75%V, 70% PWRD
Short USO
UPDATE 1:
Markets ended at the lows of the day, concluding the first week of major losses across all indices. What can we expect next week?
S&P 500.

Even though this market will most likely continue to have a downtrend direction, as we know by now nothing ever goes in one direction in a straight line. After a week of heavy selling the S&P 500 is now about 4 points away from the 50DMA which should for the time being provide strong support for an oversold bounce. So keep that in mind. Or who knows, maybe the big money will just continue to slaughter the markets silly. But recall when the markets were going up big, there would also be pullback and slightly down days to regain momentum before the next leg up.
The same works for a downtrending market. After multi day selloffs it is very likely we will see a bounce. Don't trust it for too long. But at the same time, don't go piling in hand over fists on the short side in the beginning of next week just because the selloff that ensued this week. You could get whipsawed out, and that's never fun. Always think it through.
I am going camping this memorial day weekend. Monday there is no trading so I will talk to you all on Tuesday. Have a good weekend and enjoy yourself.
-DL
Disclosure
Long GOOG, 75%V, 70%PWRD
Short USO
Thursday, May 22, 2008
New Technical Indicator - Market Velocity and Force Meter
I am pretty excited about tomorrow because the Scottrade Elite platform just had a nice upgrade. There is now a new tool call the Velocity & Forces meter.

My preliminary impression of the tool is this will be a graphical interpretation of Level II information. It will show the buying/selling force of any stock and will also indicate the velocity of the buy and sells. It calculates the information by the second, shows the current stock momentum, and the actual volume of sales.
Looks good! If anyone is currently using a different brokerage platform and have something similar to this tool, please share your experience and your thoughts about its effectiveness. Would be nice!

My preliminary impression of the tool is this will be a graphical interpretation of Level II information. It will show the buying/selling force of any stock and will also indicate the velocity of the buy and sells. It calculates the information by the second, shows the current stock momentum, and the actual volume of sales.
Looks good! If anyone is currently using a different brokerage platform and have something similar to this tool, please share your experience and your thoughts about its effectiveness. Would be nice!
$$$$$$$$$$
OH YEA! SOLF IS MONEY IN THE BANK!! I hope yall got in on some yesterday! I rode this badboy down from 28 to 23. Done deal! It could probably go lower, but I am folding.
MXC - TALK ABOUT BUBBLE BURSTING! CALLED IT! FUN'S OVER! SUCKA IS TANKING MAD TODAY DOWN 23%. I am going to trade aggressively today on MXC and PDO
It's been a very exciting first hour. We are getting a small oversold bounce today. BUT DON'T TRUST IT. You have to be ready to expect after the massive move we've made up the past 2 months that we will see more selling pressure. Stay sharp!
-DL
Disclosure
Long GOOG, 75%V
Short MXC, PDO, USO
UPDATE 1:
I'm done trading today. Covered all of my MXC and PDO shorts. I need a breather my adrealine is kicking hard. For those that say stock trading is not a good thing, or for those people out there that don't follow the investment world - I wonder how they would feel knowing we can make their monthly salary in mere hours :)
Charts tell the truth. I am a true believer, and so should you!
And by the way, keep an eye out for Visa. Let's see if we can pick it back up in the near future for 75
Disclosure
Long GOOG, 75% V
Short USO
UPDATE 2:
Keep an eye out on PWRD. I am setting up a buy order @ 25 for a 50% position. The sell volume is starting to diminish. We could see it sell off by the end of the day on light volume but if it touches 25 it could have a nice reversal bounce. I think it has been killed enough at this point.
UPDATE 3:
PWRD order filled @ 25. Closed today at 24.95 I am feeling good about this buy. If it tanks more tomorrow I will continue to build position. Let's see if it'll hit 24.5 tomorrow.
MXC and PDO .... MURDER SHE WROTE. That's all I have to say about those...
SOLF got killed bigtime today. Almost 3 bucks below my cover point. Wow. Oh well, I made my profit, I am content. If the stock breaks below 20, watch for it to pull back to its 200DMA near the 17~ level. I would probably be a buyer of the stock again at that point. And how bout them goldman sachs analyst...telling people to sell but never told anyone to buy when the stock was way down. They are so late to the party :)
USO coming down some. Encouraging indeed.
Today was one of my biggest % gain YTD. I am very happy and content. I probably will do less aggressive day trading now though for the time being. Don't want to be stupid and give all my gains back. Watch for the markets to potentially continue to tread up on light volume due to upcoming memorial day weekend. But remember, if you want to play the little bounces, be sure to USE STOPS! I can't emphasize it enough. Unless you want to be investing in the long haul (like how I do with Google and Visa), don't be overly bullish and buy stocks hand over fists right now. It could be very painful.
On the run again today. I will be back later to post tonight. Have a good one.
-DL
Disclosure:
Long GOOG, 75%V, 50% PWRD
Short USO
MXC - TALK ABOUT BUBBLE BURSTING! CALLED IT! FUN'S OVER! SUCKA IS TANKING MAD TODAY DOWN 23%. I am going to trade aggressively today on MXC and PDO
It's been a very exciting first hour. We are getting a small oversold bounce today. BUT DON'T TRUST IT. You have to be ready to expect after the massive move we've made up the past 2 months that we will see more selling pressure. Stay sharp!
-DL
Disclosure
Long GOOG, 75%V
Short MXC, PDO, USO
UPDATE 1:
I'm done trading today. Covered all of my MXC and PDO shorts. I need a breather my adrealine is kicking hard. For those that say stock trading is not a good thing, or for those people out there that don't follow the investment world - I wonder how they would feel knowing we can make their monthly salary in mere hours :)
Charts tell the truth. I am a true believer, and so should you!
And by the way, keep an eye out for Visa. Let's see if we can pick it back up in the near future for 75
Disclosure
Long GOOG, 75% V
Short USO
UPDATE 2:
Keep an eye out on PWRD. I am setting up a buy order @ 25 for a 50% position. The sell volume is starting to diminish. We could see it sell off by the end of the day on light volume but if it touches 25 it could have a nice reversal bounce. I think it has been killed enough at this point.
UPDATE 3:
PWRD order filled @ 25. Closed today at 24.95 I am feeling good about this buy. If it tanks more tomorrow I will continue to build position. Let's see if it'll hit 24.5 tomorrow.
MXC and PDO .... MURDER SHE WROTE. That's all I have to say about those...
SOLF got killed bigtime today. Almost 3 bucks below my cover point. Wow. Oh well, I made my profit, I am content. If the stock breaks below 20, watch for it to pull back to its 200DMA near the 17~ level. I would probably be a buyer of the stock again at that point. And how bout them goldman sachs analyst...telling people to sell but never told anyone to buy when the stock was way down. They are so late to the party :)
USO coming down some. Encouraging indeed.
Today was one of my biggest % gain YTD. I am very happy and content. I probably will do less aggressive day trading now though for the time being. Don't want to be stupid and give all my gains back. Watch for the markets to potentially continue to tread up on light volume due to upcoming memorial day weekend. But remember, if you want to play the little bounces, be sure to USE STOPS! I can't emphasize it enough. Unless you want to be investing in the long haul (like how I do with Google and Visa), don't be overly bullish and buy stocks hand over fists right now. It could be very painful.
On the run again today. I will be back later to post tonight. Have a good one.
-DL
Disclosure:
Long GOOG, 75%V, 50% PWRD
Short USO
Wednesday, May 21, 2008
Potential oversold bounce on the way?
Well, those of you that have been following my blog knows I've been calling the markets to correct sharply. And today the culmination of oil hitting a new historic high coupled with the fed stating they are done cutting rates finally did the trick.
I think tomorrow and going into Friday because it is memorial day weekend we could potentially see a small bounce on light volume. If you are going to be playing any oversold bounces be sure you keep that stop in place. I don't think we are done going down yet though - Not even close
I mentioned yesterday I would be all over the SOLF short should it pop due to earnings and that's exactly what I did. Shorted it right in the morning at $28 so I am up comfortably right now. Tomorrow we could see some more profit taking come in. If you are on the short trade like me, watch these levels of support:
S1 $24.77
S2 $23.04
S3 $20.84
I am on the run today. Invest wisely and be careful out there.
-DL
Disclosure:
Long GOOG, V
Short SOLF, USO
I think tomorrow and going into Friday because it is memorial day weekend we could potentially see a small bounce on light volume. If you are going to be playing any oversold bounces be sure you keep that stop in place. I don't think we are done going down yet though - Not even close
I mentioned yesterday I would be all over the SOLF short should it pop due to earnings and that's exactly what I did. Shorted it right in the morning at $28 so I am up comfortably right now. Tomorrow we could see some more profit taking come in. If you are on the short trade like me, watch these levels of support:
S1 $24.77
S2 $23.04
S3 $20.84
I am on the run today. Invest wisely and be careful out there.
-DL
Disclosure:
Long GOOG, V
Short SOLF, USO
Tuesday, May 20, 2008
MXC and PDO - Ticking Time Bombs Ready to Blow
Look at these two companies Mexco Energy Corp (MXC) and Pyramid Oil (PDO)
MXC

-MXC a mere ONE MONTH AGO was a 5 dollar stock that have EXPLODED EXPONENTIALLY all the way to the close today of $42.53. That equates to a near 700% INCREASE
PDO

- PDO in the last month have gone from 5 dollars to the close today of $22.85 = 381% INCREASE
If these are not bubble status stocks I don't know what is. Especially MXC.
Keep in mind these are small cap stocks and could have very unpredictable moves. But I am about ready to jump in on the shorts because when the profit taking comes in full gear, THESE STOCKS ARE GOING TO DEFINE THE MEANING OF A BUBBLE EXPLODING.
Watch these two plays in the days to come.
- DL
MXC

-MXC a mere ONE MONTH AGO was a 5 dollar stock that have EXPLODED EXPONENTIALLY all the way to the close today of $42.53. That equates to a near 700% INCREASE
PDO

- PDO in the last month have gone from 5 dollars to the close today of $22.85 = 381% INCREASE
If these are not bubble status stocks I don't know what is. Especially MXC.
Keep in mind these are small cap stocks and could have very unpredictable moves. But I am about ready to jump in on the shorts because when the profit taking comes in full gear, THESE STOCKS ARE GOING TO DEFINE THE MEANING OF A BUBBLE EXPLODING.
Watch these two plays in the days to come.
- DL
Market Update, PWRD, SOLF, OIL
Well the markets really sold off rather steeply today. The Dow was down 200 points to close @ 12,828. The Nasdaq down 23 points @ 2,492. And the S&P down 13 @ 1,413. Oil today hit another all time high to close @ 129 dollars. And the PPI data released confirmed the threat of inflation...
All that is jibberish in my opinion. Want to know the real truth? As I have said before in the past, the markets follow TECHNICALS. Even though the news feed is important, in my opinion it's just a cover, or better yet, catalyst, to give the markets the extra little push to buy/sell. Following technicals is much better than listening to headlines and the Wall Street media BS. If anyone listened to those clowns a few days ago (I like Jim Cramer because he is the ultimate contrarian to market sentiment), they would have been another victim of the "retail investors getting robbed by wall street" statistic.
PWRD - A stock I've pounded the table to short when it hit $30 bucks and beyond, got annihilated the past two sessions. I hope some of you hopped on the short bus and rode this baby down - congrats to you on making nearly 20% in two sessions. But watch out now for a potential rebound in the making.

Since the bulls took it on the chin pretty hard the past two sessions, we are likely not going to see this IMMEDIATELY rebound. With that said:
- Indicators are nearing oversold status.
- It is currently at the 50 and 200DMA. Even though from the first glimpse it appears to have pierced those averages, be careful of the potential fakeout.
- Note the "M" pattern that formed perfectly from the price action.
PWRD closed at the lows of the session, so tomorrow we could continue to see even more selling pressure come in. But if you are short, that would be the opportunity to start locking those gains in. Pay attention to these 3 support levels (I'll name them S1, S2, S3)
S1 - $24.91
S2 - $24.26
S3 - $23.06
Compliments of the Mojo Pivot Point Calculator.
If the stock continues to selloff tomorrow, consider setting your cover at these targets. If you are looking for an entry point to go long, consider these to be the targets you would want to start building long position. The numbers are calculated based on today's Open, high, low, and closing price.
SOLF
- We didn't see too much action today because the gigantic move it has already had. They are set to report tomorrow morning. I do not have a position into earnings but if you do, I wish you the best. It will probably come out above analyst estimates (and it better). If it blows out by a huge margin the stock could have another gigantic short squeeze that'll push it up bigtime.
(35% short interest according to ShortSqueeze.com )

But if they disappoint in any way, or just comes in line with expectation. You better believe the bears are going to come stampeding to take the "fun" out of SolarFun. JUST LOOK AT HOW EXTENDED AND OVERBOUGHT IT IS! If I had to guess, I'm going to say they are going to have a sell the news plunge tomorrow. If it pops big tomorrow I am going to go on record now and say I'll be all over the shorts.
Oil
- Yes, once again, oil makes another historic high. Today I think based on comments made by an oil mogul Boon Pickens who initially said oil was a short at 100, but today on CNBC reversing his stance and going long.
USO rallied another $1.5 to close at 104.30. Very impressive indeed. But I am going to continue to take the contrarian view here and say oil is due for a very sharp correction. Whenever there are "moguls" coming out proclaiming IN PUBLIC they are going long, when we have Goldman Sachs raising their targets, and when we have the news channel every single day pounding the table to go long oil, that to me is the indicator to sell. The big money is probably still bidding up the stocks to try to get as many retail investors on board to go long. And then in one swoop they will take them all out hard and fast.
I will not go long oil here. Am I losing money on my oil short? Ya I am...down 4.3% to be exact. But I am very convinced this move will be coming to an end soon. There's simply too much publicity about this right now, the technical charts are way over extended, and the sentiment is way too bullish.
So if you're considering going long oil, be sure to keep stops in place to protect your profits. Take the lesson in Gold and what happened when the price was at $1,000 everyone said "$2,000 gold here we come!" And then gold subsequently took a ~$150 nosedive.
Invest wisely. And always remember - Charts tell the truth.
- DL
Disclosure:
Long GOOG, 75% V
Short USO
All that is jibberish in my opinion. Want to know the real truth? As I have said before in the past, the markets follow TECHNICALS. Even though the news feed is important, in my opinion it's just a cover, or better yet, catalyst, to give the markets the extra little push to buy/sell. Following technicals is much better than listening to headlines and the Wall Street media BS. If anyone listened to those clowns a few days ago (I like Jim Cramer because he is the ultimate contrarian to market sentiment), they would have been another victim of the "retail investors getting robbed by wall street" statistic.
PWRD - A stock I've pounded the table to short when it hit $30 bucks and beyond, got annihilated the past two sessions. I hope some of you hopped on the short bus and rode this baby down - congrats to you on making nearly 20% in two sessions. But watch out now for a potential rebound in the making.

Since the bulls took it on the chin pretty hard the past two sessions, we are likely not going to see this IMMEDIATELY rebound. With that said:
- Indicators are nearing oversold status.
- It is currently at the 50 and 200DMA. Even though from the first glimpse it appears to have pierced those averages, be careful of the potential fakeout.
- Note the "M" pattern that formed perfectly from the price action.
PWRD closed at the lows of the session, so tomorrow we could continue to see even more selling pressure come in. But if you are short, that would be the opportunity to start locking those gains in. Pay attention to these 3 support levels (I'll name them S1, S2, S3)
S1 - $24.91
S2 - $24.26
S3 - $23.06
Compliments of the Mojo Pivot Point Calculator.
If the stock continues to selloff tomorrow, consider setting your cover at these targets. If you are looking for an entry point to go long, consider these to be the targets you would want to start building long position. The numbers are calculated based on today's Open, high, low, and closing price.
SOLF
- We didn't see too much action today because the gigantic move it has already had. They are set to report tomorrow morning. I do not have a position into earnings but if you do, I wish you the best. It will probably come out above analyst estimates (and it better). If it blows out by a huge margin the stock could have another gigantic short squeeze that'll push it up bigtime.
(35% short interest according to ShortSqueeze.com )

But if they disappoint in any way, or just comes in line with expectation. You better believe the bears are going to come stampeding to take the "fun" out of SolarFun. JUST LOOK AT HOW EXTENDED AND OVERBOUGHT IT IS! If I had to guess, I'm going to say they are going to have a sell the news plunge tomorrow. If it pops big tomorrow I am going to go on record now and say I'll be all over the shorts.
Oil
- Yes, once again, oil makes another historic high. Today I think based on comments made by an oil mogul Boon Pickens who initially said oil was a short at 100, but today on CNBC reversing his stance and going long.
USO rallied another $1.5 to close at 104.30. Very impressive indeed. But I am going to continue to take the contrarian view here and say oil is due for a very sharp correction. Whenever there are "moguls" coming out proclaiming IN PUBLIC they are going long, when we have Goldman Sachs raising their targets, and when we have the news channel every single day pounding the table to go long oil, that to me is the indicator to sell. The big money is probably still bidding up the stocks to try to get as many retail investors on board to go long. And then in one swoop they will take them all out hard and fast.
I will not go long oil here. Am I losing money on my oil short? Ya I am...down 4.3% to be exact. But I am very convinced this move will be coming to an end soon. There's simply too much publicity about this right now, the technical charts are way over extended, and the sentiment is way too bullish.
So if you're considering going long oil, be sure to keep stops in place to protect your profits. Take the lesson in Gold and what happened when the price was at $1,000 everyone said "$2,000 gold here we come!" And then gold subsequently took a ~$150 nosedive.
Invest wisely. And always remember - Charts tell the truth.
- DL
Disclosure:
Long GOOG, 75% V
Short USO
Monday, May 19, 2008
My Trading Platform
I've got a few readers that emailed me or left a comment interested in knowing how I setup my trading platform. So here it is.
When I trade I run my tools on two laptops (Scottrade Elite), one on desktop (Charles Schwab StreetSmart Pro), and I have the TV flipped to the business media channel (Split PIP with Bloomberg and CNBC). So altogether I have 4 screens running simultaneously.
On my first laptop I setup the screen to monitor the daily indices movement (This is Scottrade Elite)

I can maximize any screen at any time to look at the Dow, Nasdaq, and the S&P. In the middle is the day's most actively traded Spiders which has every single sector's index on it. They provide a great indicator of the sector strength during the day. On the top I also have a quote grid which has my top 20 most followed stocks (all the numbers fluctuate live during the trading session)
Here is the second screen.

My second screen is the Market Statistic screen. Here I can see decliners vs advancers on all the indices as well as market breadth (VIX meter and all that goodies). There's a lot more to it but the page is not big enough to show everything here. These indices update live during the trading session. I can also read market news, sector news, fixed income (bond yields), etc. This provides vital information to the health of the market and throughout the trading session I pay a lot of attention to this screen to determine market sentiment.
Here is the third screen

This is my main Technical Analysis page. Just like all the other ones I can maximize any screen I want to have a full expanded view. At the bottom is the streaming news. Anything new happening with any stock during the course of the day will immediately be updated there.
The middle screen is a live Level II ticker of the price action. Bid/Ask prices and their quantities are all shown there.
The top screen are the in depth numbers of any one stock I am observing. Note all of it changes in real time when the markets are open.
And on the right is my TA setup. I use a 2-day 10 minute intraday chart. What this means is every "candle" on the chart represents 10 minutes of time. While it is also important to have an expanded view of the stocks (which I can easily change), I focus primarily on this setup when I'm swing/day trading.
The technical indicators and tools I use are:
- 20, 50, and 200 DMA
- Bollinger Bands
- Volume
- Momentum Indicator
- Stochastics Slow
- Relative Strength Index
I don't use the MACD because that is a lagging indicator during a trading period.
When I need to execute orders, I don't have to go through a confirmation screen. What I do is I select order entry, I type in the stock I want and the quantity, and then there are 4 actions I can take. Buy, Sell, Buy to Cover, Short

So basically, If I want to buy the stock, I press the buy button and my order will immediately execute. Same with all the other function. I can also set limit orders, stop loss prices, breakout buy, trailing stops. All are available there. The response time on Scottrade is very fast. Usually within 2 seconds my order will execute.
When I execute an order, there will be a log that shows my trades along with the time stamp, the action I took, quantity of shares demanded, and whether the trade was executed successfully. Here are some of the trades I did today.

Even though Scottrade doesn't provide all the premium services more expensive brokerages will provide (Schwab, Fidelity etc.,) you can't really go wrong with $7 dollar trades. And honestly the trading platform in my opinion is second to none. Not even the Charles Schwab platform is as good as this (which is what I run on my desktop). The only thing that Scottrade lacks is the independent research on stocks. This is where Charles Schwab excels because it has Goldman Sachs, Argus, Charles Schwab Report, Reuters, VIX report, and the S&P report. All for free. VERY VERY good analysis.
It's hard to show everything the Scottrade platform does though with only 3 screenshot. You have to see it for yourself. But in my opinion, this is a very respectable platform and should provide sufficiently everything you need to trade.
When I trade I run my tools on two laptops (Scottrade Elite), one on desktop (Charles Schwab StreetSmart Pro), and I have the TV flipped to the business media channel (Split PIP with Bloomberg and CNBC). So altogether I have 4 screens running simultaneously.
On my first laptop I setup the screen to monitor the daily indices movement (This is Scottrade Elite)

I can maximize any screen at any time to look at the Dow, Nasdaq, and the S&P. In the middle is the day's most actively traded Spiders which has every single sector's index on it. They provide a great indicator of the sector strength during the day. On the top I also have a quote grid which has my top 20 most followed stocks (all the numbers fluctuate live during the trading session)
Here is the second screen.

My second screen is the Market Statistic screen. Here I can see decliners vs advancers on all the indices as well as market breadth (VIX meter and all that goodies). There's a lot more to it but the page is not big enough to show everything here. These indices update live during the trading session. I can also read market news, sector news, fixed income (bond yields), etc. This provides vital information to the health of the market and throughout the trading session I pay a lot of attention to this screen to determine market sentiment.
Here is the third screen

This is my main Technical Analysis page. Just like all the other ones I can maximize any screen I want to have a full expanded view. At the bottom is the streaming news. Anything new happening with any stock during the course of the day will immediately be updated there.
The middle screen is a live Level II ticker of the price action. Bid/Ask prices and their quantities are all shown there.
The top screen are the in depth numbers of any one stock I am observing. Note all of it changes in real time when the markets are open.
And on the right is my TA setup. I use a 2-day 10 minute intraday chart. What this means is every "candle" on the chart represents 10 minutes of time. While it is also important to have an expanded view of the stocks (which I can easily change), I focus primarily on this setup when I'm swing/day trading.
The technical indicators and tools I use are:
- 20, 50, and 200 DMA
- Bollinger Bands
- Volume
- Momentum Indicator
- Stochastics Slow
- Relative Strength Index
I don't use the MACD because that is a lagging indicator during a trading period.
When I need to execute orders, I don't have to go through a confirmation screen. What I do is I select order entry, I type in the stock I want and the quantity, and then there are 4 actions I can take. Buy, Sell, Buy to Cover, Short

So basically, If I want to buy the stock, I press the buy button and my order will immediately execute. Same with all the other function. I can also set limit orders, stop loss prices, breakout buy, trailing stops. All are available there. The response time on Scottrade is very fast. Usually within 2 seconds my order will execute.
When I execute an order, there will be a log that shows my trades along with the time stamp, the action I took, quantity of shares demanded, and whether the trade was executed successfully. Here are some of the trades I did today.

Even though Scottrade doesn't provide all the premium services more expensive brokerages will provide (Schwab, Fidelity etc.,) you can't really go wrong with $7 dollar trades. And honestly the trading platform in my opinion is second to none. Not even the Charles Schwab platform is as good as this (which is what I run on my desktop). The only thing that Scottrade lacks is the independent research on stocks. This is where Charles Schwab excels because it has Goldman Sachs, Argus, Charles Schwab Report, Reuters, VIX report, and the S&P report. All for free. VERY VERY good analysis.
It's hard to show everything the Scottrade platform does though with only 3 screenshot. You have to see it for yourself. But in my opinion, this is a very respectable platform and should provide sufficiently everything you need to trade.
Subscribe to:
Posts (Atom)